Authors


Article Highlights
- Disparities start early and persist as kids get older
- Data show gaps in school readiness, disciplinary actions, testing, and college attainment
- Gaps ultimately result in vast income gulfs
Minnesotans can build a more inclusive economy by addressing racial inequities in the state’s education system. Native American children and children of color in the state face unequal opportunities from infancy into adulthood. This article highlights evidence of how systemic racism undermines the education system in Minnesota. We begin by examining evidence on early childhood education, followed by K-12 education and postsecondary education.
Over the course of a child’s educational career, measures of disparities change, but the story remains the same: children of color have fewer opportunities to succeed. Minnesota’s Black, Latino/a, Native American, and Asian children often enter kindergarten less prepared for school than their White non-Latino/a peers.1 Gaps in important school-related skills and knowledge among kindergarteners persist as children get older. Some of Minnesota’s educational disparities are among the worst in the nation (Grunewald and Nath 2019); White children generally perform better than their national peers, while Native American children and children of color perform worse. After elementary school children enter high school, Native American children and children of color are less likely to graduate, or to have access to important opportunities like dual enrollment in top-tier institutions of higher learning (Minnesota’s Statewide Longitudinal Education Data System, or SLEDS, no date; Trost 2016).
Watch now
A look at Minnesota’s educational disparities
Learn more about the persistent educational disparities that are affecting students across the state.
Post-secondary education is still a powerful tool for increasing incomes, even though Native American workers and workers of color face systemic racism in the job market regardless of their level of education. Unfortunately, the disparities found in kindergarten and traced along a lifetime eventually reinforce income-based racial disparities.
Research shows that a range of interventions are effective in disrupting these patterns. For example, high-quality early childhood development programs benefit children and society, lift incomes, improve health, and reduce crime (Rolnick and Grunewald 2003). The benefits of public investments in early childhood development are particularly significant for children of color (Bauer and Schanzenbach 2016). And among school-age children, some schools and states are showing signs of success in closing achievement gaps. For example, students in the Harlem Children’s Zone’s Promise Academy have shown strong gains in achievement (Grunewald and Nath 2019), which in turn can narrow gaps in postsecondary attainment.
Disparities have an early start
Investments in child development in the first few years of life—by families, early childhood development programs, and communities—can have a large effect on a child’s future. During this time, a child’s experiences shape the brain’s rapid development. That’s why disparities in children’s development—and in their basic survival and wellness—can begin during children’s earliest days. In Minnesota, infant mortality rates for Native American and Black children are more than twice as high as those for White children (Minnesota Department of Health, or MDH, n.d.). And Minnesota-born Native American infants and infants of color are more likely to have a low birthweight compared with White children (MDH n.d.). Disparities in social and economic conditions and health care access influence these outcomes. Data suggest early-life inequalities like these are difficult to close (Bradbury et al. 2015).
Because childhood development is heavily influenced by the resources available to children and their families, gaps in school-readiness measures reveal more than gaps in just one measure of achievement; they put racial gaps in opportunity on display. Results from a series of school-readiness studies by the Minnesota Department of Education from 2006 to 2012 indicate early differences by race.2
In these studies, school readiness is defined using a School Readiness Checklist that assesses children’s physical, personal, and social development, as well as their ability to perform tasks related to the arts, language and literacy, and math. Students are deemed “school-ready” if they meet or exceed 75 percent of the possible points on the checklist. As shown in Figure 1, Asian/Native Hawaiian/Pacific Islander students had the highest rate of proficiency on the study’s school-readiness checklist, at 82 percent, followed by White students at 78 percent and Black or African American students at 74 percent. Native American and Latino/a students had the lowest proficiency rates, at 62 percent and 68 percent, respectively.3
Kindergarteners’ score disparities may be influenced by opportunity gaps in the state’s early childhood education sector. Children are not guaranteed access to early childhood education, and the child care market is largely financed by parents’ private tuition payments. Large racial disparities in income thus leave Native American families and families of color with fewer resources to pay for the high-quality child care that can prepare children to succeed in school.
These income gaps are large: the median family income in Minnesota for Native American, Black, and Latino/a families with children ranges from $34,000 to $52,900, compared to $108,600 for White families with children (National KIDS COUNT 2019).
While the median income for Minnesota’s Asian families with children is relatively high, at $90,000, a disproportionate share of such families have low incomes: 40 percent of Asian children live in families with incomes that are below 200 percent of the federal poverty level, more than twice that of the share of White families with children. This income threshold changes by family size—for example, it translates to about $51,000 for a family of two adults and two children (National KIDS COUNT 2019).
The racial income gap appears particularly large in light of the high cost of care relative to typical incomes for families with children. A typical child care center charges between $8,200 and $15,900 annually for full-time care for a toddler, depending on the regional market within Minnesota.
State and federal dollars subsidize some households’ access to early childhood education, and many of the subsidy programs serve Native American children and children of color. But these subsidies are not available to all eligible families because their total funding is limited. For example, Minnesota’s Child Care Assistance Program (CCAP) provides child care subsidies to about 15,000 families that meet income and other eligibility requirements. In 2015, the state’s human services agency estimated that if demand for the program were fully funded by the state legislature, CCAP would reach about 29,000 families.
Other income-targeted subsidies for early childhood education, like Head Start, Early Head Start, and the state’s Early Learning Scholarships, also serve only a portion of eligible families. Like CCAP, these programs maintain wait lists that likely represent only a fraction of eligible families that would access the services if they were fully funded.
When families of color do access early childhood education, their children are often subject to inequitable treatment (Gilliam et al. 2016). For example, U.S. data from 2015 through 2016 show that Black boys represented 19 percent of public preschool enrollment but 45 percent of male preschool suspensions, and Black girls represented 20 percent of public preschool enrollment but 54 percent of female preschool suspensions. Research suggests that educator bias plays an important role in contributing to these disparities (Meek et al. 2020).
Gaps persist during the K-12 years
Disparities prior to kindergarten are followed by inequitable access to quality K-12 education. This matters for children’s life fortunes: high-quality education, including career and technical education, can lead to better jobs (U.S. Department of Education 2019), higher incomes (U.S. Bureau of Labor Statistics, or BLS, 2019), better housing options,4 and improved health outcomes (Hahn and Truman 2015).
Minnesota often ranks among the top states in terms of standardized test scores and college readiness (Grunewald and Nath 2019). But this ranking obscures Minnesota’s large achievement gaps by race and ethnicity. These disparities are among the largest in the nation, and show no signs of diminishing.
In some cases, the gaps have increased over time. For example, the White-Black gap for the median grade eight math score increased from 36 points in 2011 to 45 points in 2019 (National Assessment of Educational Progress, n.d.). School quality does not solely account for these disparities, but there is evidence that higher school quality can lead to stronger student performance. A study in Chicago shows that when school effectiveness—defined in terms of effects on students’ test scores, socioemotional development, and behaviors in ninth grade—is high, it has a positive effect on long-term outcomes (e.g., school-based arrests or college enrollment) among Black and Latino/a students who are least likely to attain more years of education (Jackson et al. 2020).
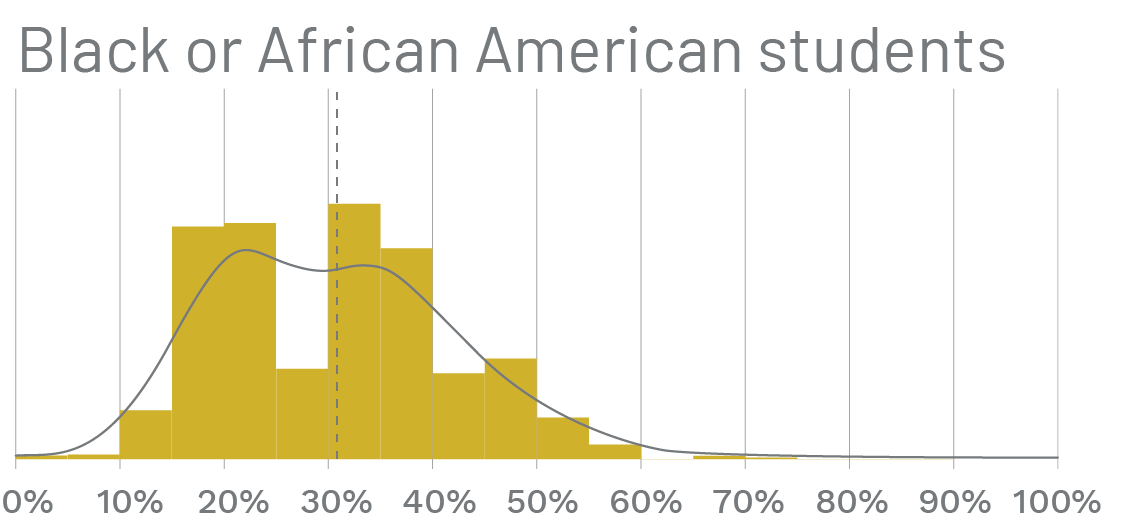
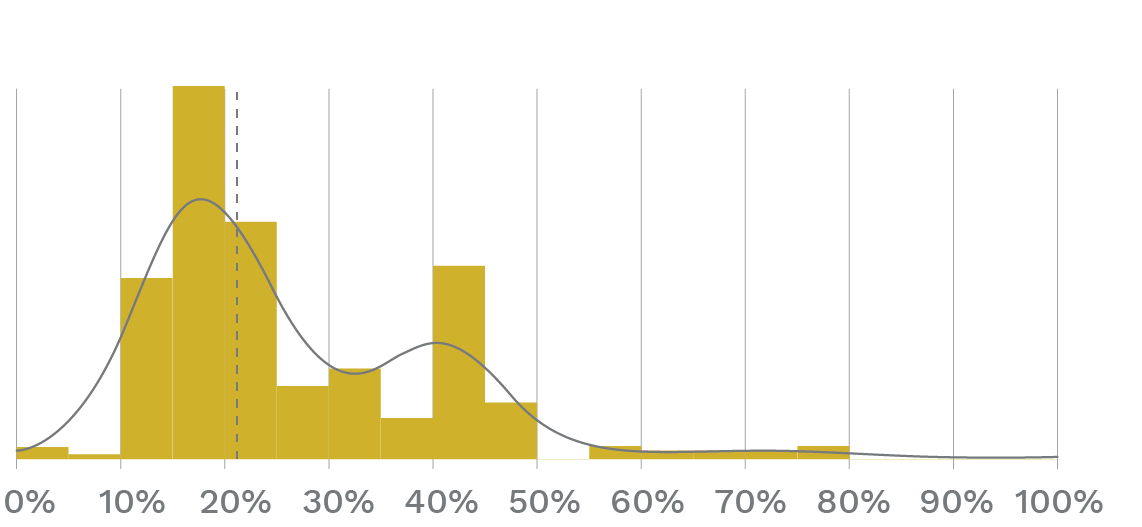
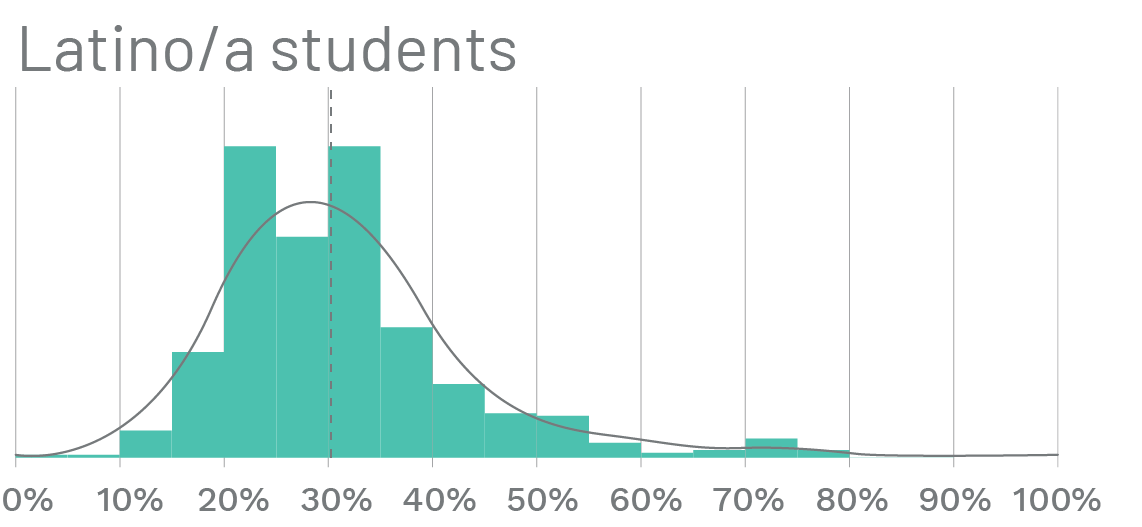
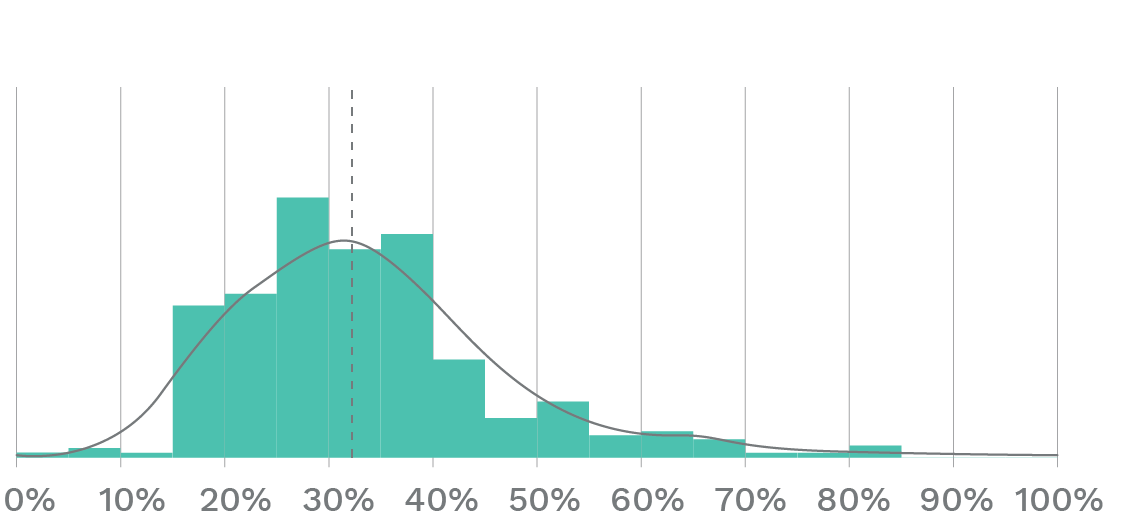
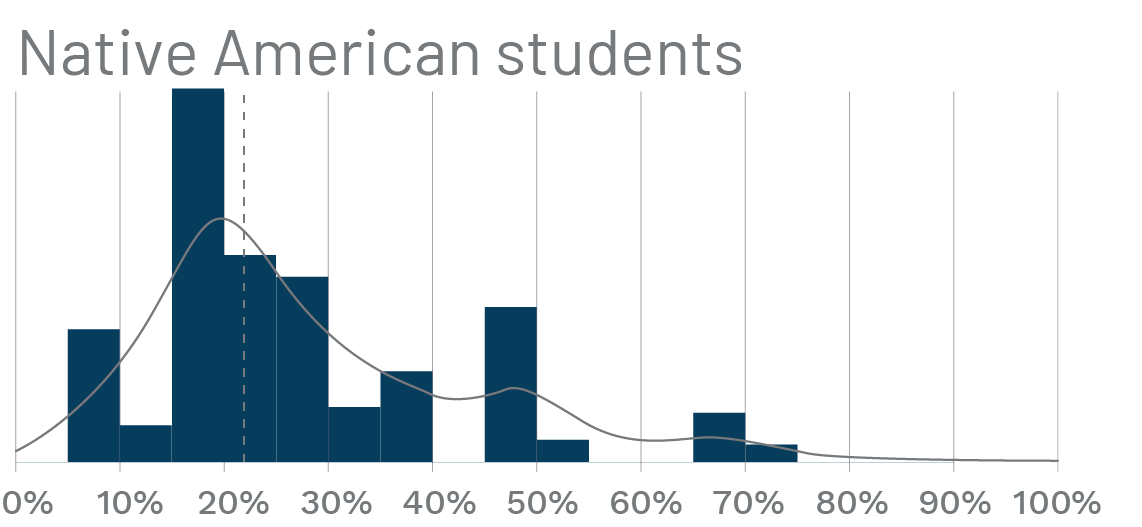
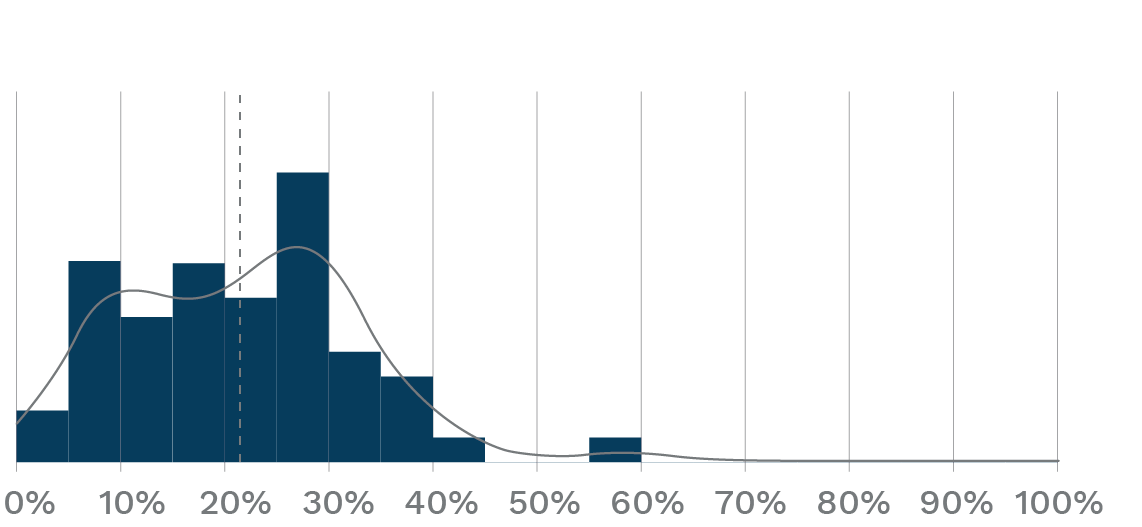
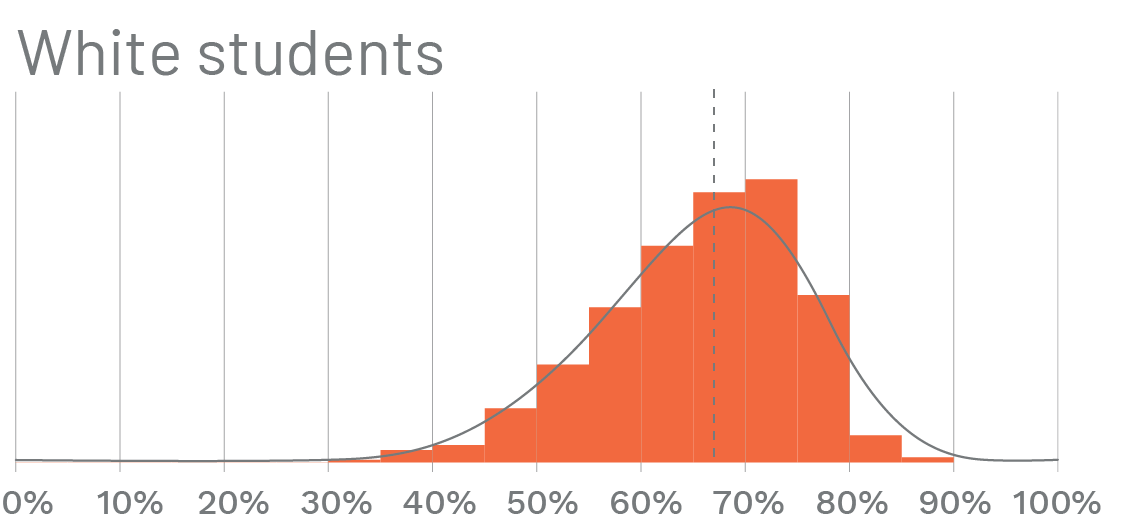
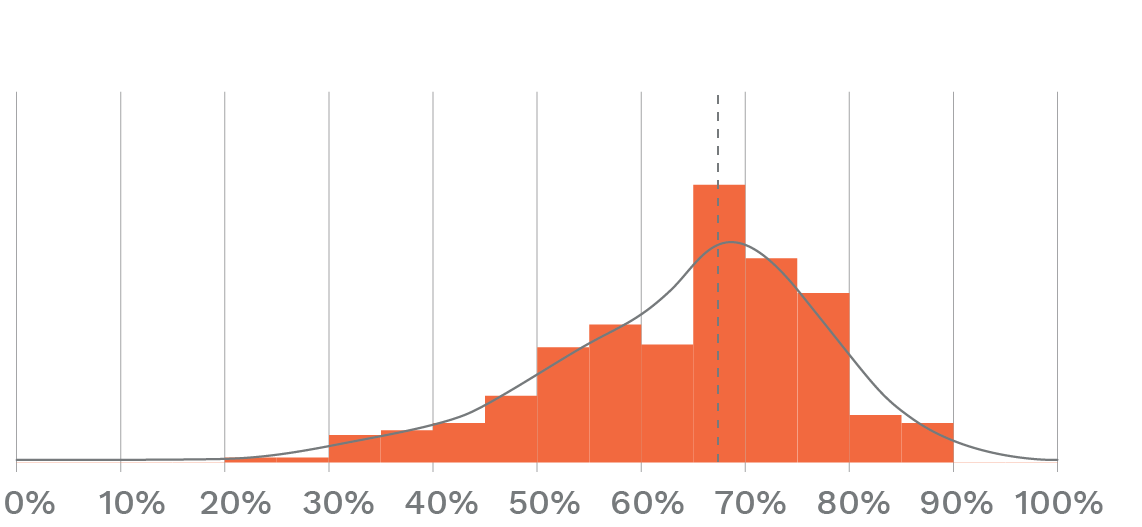
Source: Minnesota Department of Education, 2018–2019.
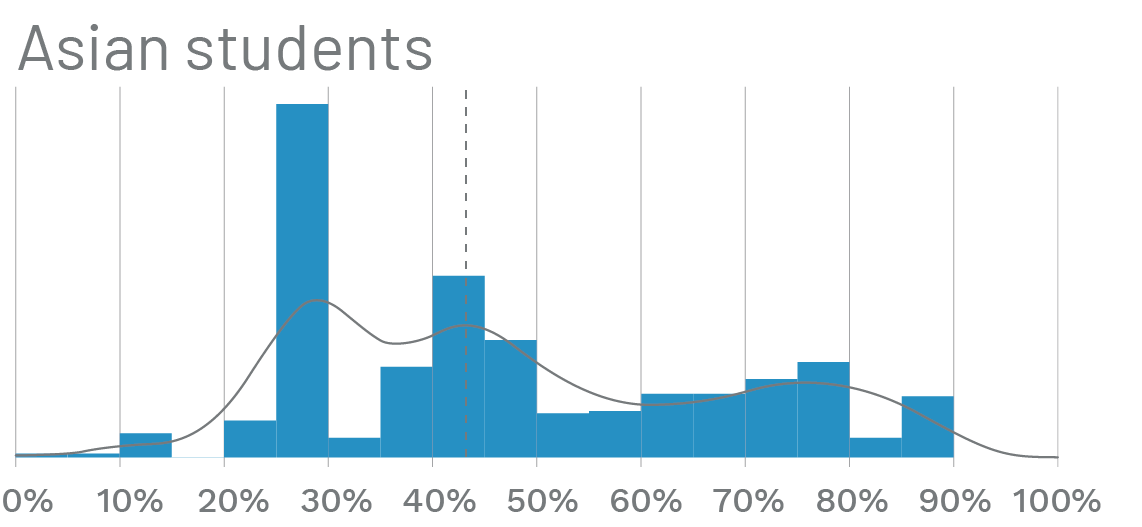
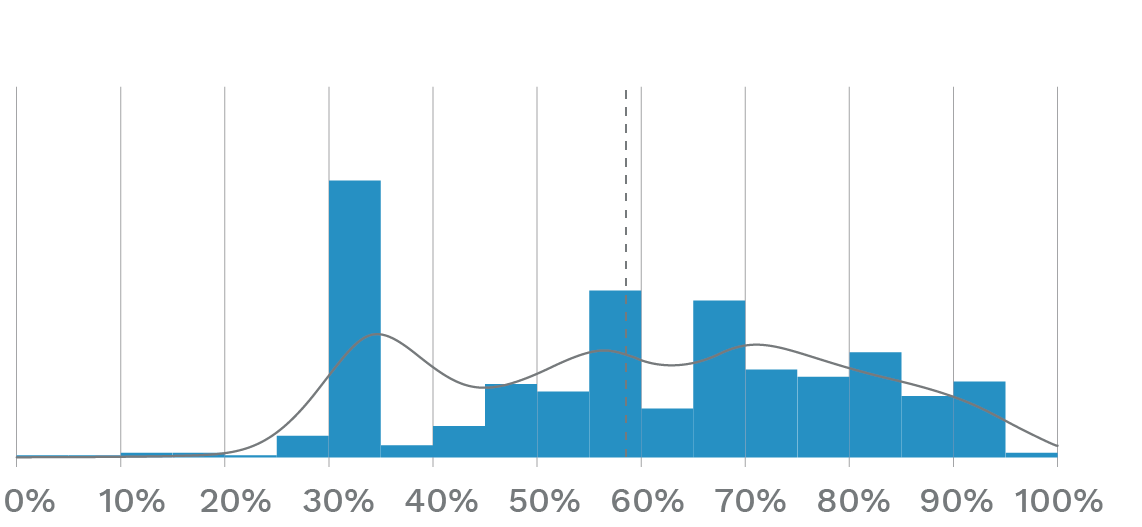
As shown in Figure 2, Native American students and students of color are more likely to have low scores on key standardized tests. For example, the median Native American student attended a school district in which 21.8 percent of Native American students were proficient in grade four reading and 21.4 percent were proficient in grade eight math, compared to 66.9 percent in reading and 67.5 percent in math among White students. We highlight grade four reading proficiency because reading is a key factor in fourth-grade students’ ability to learn in successive grades. Grade eight math proficiency is a predictor of college and career readiness (Grunewald and Nath 2019).
Focusing on an average or median statistic can mask important nuances in the data. This is especially notable in the case of Asian students in Minnesota, whose distributions of both reading and math proficiency are quite dispersed relative to other groups. Among Asian students, the top 25 percent are enrolled in schools where more than 63 percent of Asian students are proficient in grade four reading and 76 percent in grade eight math, while the bottom 25 percent are enrolled in schools where less than 30 percent are proficient in grade four reading and 45 percent in grade eight math.
Educational disparities between racial and ethnic groups are to some extent linked with differences in families’ and schools’ economic resources. Across racial groups, students eligible for free or reduced-price lunches—a proxy for low-income students—score much lower than those who are not (Grunewald and Nath 2019). Schools serving Native American students and students of color often have fewer resources to offer their students. For example, Minnesota data show that Native American students and students of color tend to attend schools with less-experienced teachers (Grunewald and Nath 2019). Without the resources necessary to recruit and retain teachers, schools that serve more students of color are at a disadvantage.
Other factors are also relevant: for example, evidence suggests that students perform better on standardized tests when they learn from teachers who share their racial and ethnic background (Learning Policy Institute 2018; Center for American Progress 2017). This may partly be because White teachers are more likely to exhibit bias against students who are not of their racial and ethnic background (Chin et al. 2020). Black students who had a Black teacher in grades K-3 were also more likely to graduate high school and enroll in college compared to those who did not (Gershenson et al. 2018), potentially due to exposure to positive role models or through reduced teacher bias.
Given this evidence, it is important to note that most schools in Minnesota do not have a diverse teaching staff. Between 2008 and 2018, the proportion of students of color rose from 24 percent to 34 percent across Minnesota’s public schools, but the proportion of teachers of color remained constant at around 5 percent (Star Tribune 2018).
Another important factor is revealed by data on disciplinary actions, which show how teachers and school staff often treat students of color differently than White students. Native students and students of color make up about one-third of Minnesota’s overall student population but they receive two-thirds of all suspensions and expulsions. Native American and Black students are ten times and eight times more likely, respectively, to be suspended or expelled than their White peers (Minnesota Department of Human Rights 2018). The ramifications of suspensions and expulsions extend beyond the immediate punishment a student faces. Disciplinary actions are associated with higher dropout rates and higher likelihood of involvement in the juvenile justice system (Fabelo et al. 2011).
Minnesota data also show that students of color are less likely to participate in programs related to college and career readiness. For example, among 2019 Minnesota high school graduates, more than 40 percent of White and Asian students participated in dual enrollment (including Postsecondary Enrollment Options and Concurrent Enrollment), compared to around 25 percent of Native American, Black, and Latino/a students (SLEDS n.d.). High schools with a high proportion of students of color have fewer dual-enrollment opportunities and are more likely to partner with less-selective postsecondary institutions, contributing to racial and ethnic gaps in postsecondary education (Trost 2016).
College gaps become income gaps
The K-12 opportunity gap leaves Native American students and students of color less prepared to graduate high school and succeed in college.5 In 2018, the White-Black gap in high school graduation was about 14 percentage points (Grunewald and Nath 2019). Black and Latino/a students were about 40 percentage points and 30 percentage points less likely than White students to be “college-ready,” respectively, as measured by their math preparation. These gaps are both in the top two largest across all the states (Grunewald and Nath 2019).6
Native American, Black, and Latino/a students are less likely to attend college than White students and are also less likely to finish when they do attend. Among Minnesota’s high school graduating class of 2016 who enrolled in college, 38 percent of Native American students, 51 percent of Latino/a students, and 52 percent of Black students remained enrolled in their fourth academic year, compared to 68 percent of Asian students and 71 percent of White students (SLEDS n.d.). Similarly, among 2008 college entrants nationwide, only 41 percent of Black students and 53 percent of Latino/a students completed their degree within six years, compared to 63 percent of White students (Deming 2017).
Much of the completion rate gaps can be traced to differences in college readiness, which in turn depend on high school quality (Arcidiacono and Koedel 2014).7 Native American students and students of color, especially Black and Latino/a students, are all more likely to enroll in developmental education in college—a program for students who require additional academic preparation to be successful. Additionally, Black and Latino/a students are much more likely to attend high schools where relatively few graduates go on to attend and complete college (Carnevale and Rose 2013).
These gaps remain large when we look at educational attainment by racial and ethnic groups. As panel (a) of Figure 3 shows, Minnesota’s Native American population has the smallest percentage of 25- to 54-year-olds with a bachelor’s degree or more, followed by the Latino/a population, Black population, and Hmong population. The educational attainment of the Hmong population (along with the Karen and Karenni, Cambodian, and Laotian populations) is the lowest among the Asian population in Minnesota.8 About three of every four of the state’s Hmong adults have not earned a high school diploma or equivalent.9
Why are these racial disparities important? College graduates’ incomes increased more quickly than those of non-college-graduates for much of the latter half of the twentieth century (Autor, Goldin, and Katz 2020). Since 2000, that difference has remained at a historically high level, and Minnesota college graduates typically earn more money than their non-college-educated peers—an advantage that is to a large extent caused by attending college (Oreopoulos and Petronijevic 2013). College graduation is associated with substantial improvements in non-earnings outcomes, as well. Graduates are less likely to be unemployed (BLS 2019), tend to enjoy better health (Oreopoulos and Petronijevic 2013), and even experience lower mortality rates (Hummer and Hernandez 2018).
Within racial groups, the four-year college wage boost varies to some degree, though it is always large. As panel (b) of Figure 3 shows, even with the strong returns to postsecondary education across the board, college-educated White and Asian (excluding Hmong) Minnesotans tend to earn much more than their college-educated Black, Hmong, Latino/a, and Native American peers.
Our schools should serve all students
The opportunity gaps Minnesota’s children face are deeply troubling. These gaps persist across age groups and represent challenges to the state that extend beyond its education system. The systemic racism that prevents many of Minnesota’s children from getting a high-quality education ultimately has economic implications: if children aren’t given the tools to reach their full potential, the workforce of the future will be weaker as a result.
This article does not focus on the solutions in support of that goal, but a robust body of research illuminates potential solutions. Practitioners, academics, and policymakers have all explored and rigorously tested means for addressing racial bias in the classroom, designing high-quality early childhood education, and better supporting students as they enter college or the workforce.
A common theme among successful interventions is that they must engage with and be designed for the communities they intend to support. Given the persistence of opportunity gaps and the evidence that they are tied to systemic racism, we would argue that those interested in eliminating disparities must also pursue strategies that place race at the center.
The authors thank Oriane Casale, Meredith Fergus, Ellen Guettler, Diane Haulcy, Debbie Hewitt, and Alessia Leibert for insightful feedback on an earlier draft.
Endnotes
1 For simplicity, hereafter we refer to White non-Latino/a as White. In this analysis, the Black, Native American, and Asian racial groups are also exclusive of Latino/a origin.
2 After the 2012 study, the Minnesota Department of Education transitioned to the Kindergarten Entry Profile initiative, a voluntary standards-based assessment system that provides school districts and charter schools that offer Voluntary PreK or School Readiness Plus programs a menu of comprehensive, developmentally appropriate assessments and a data submission and reporting system.
3 The Minnesota Department of Education study found that race and ethnicity were not statistically significant characteristics in reaching a 75 percent proficiency standard when holding other variables constant, including household income, parent education level, primary home language, and gender. Household income was a statistically significant factor; however, systemic racism faced by families of color can contribute to differences in household income and, through that channel, differences in K-12 outcomes. In our previous article on racial disparities, we showed that there is a large gap in earnings between White workers and Latino/a, Black, and Native American workers.
4 Based on the 2014–2018 American Community Survey Public Use Microdata Sample, housing cost burden (defined as housing costs above 30 percent of income) decreases with increasing levels of educational attainment among Minnesota adults as well as among U.S. adults.
5 We define college readiness as a student’s ability to successfully complete first-year math and English courses at postsecondary institutions.
6 In reading preparation, the difference was 34 percentage points between White and Black students, and 27 percentage points between White and Latino/a students.
7 Of Minnesota’s high school graduating class of 2018, 45 percent of Black students, 31 percent of Latino/as, 25 percent of Asians, 24 percent of Native Americans, and 14 percent of Whites enrolled in developmental education in the first two years in college. (SLEDS 2020).
8 Authors’ calculation using 2014–2018 American Community Survey Public Use Microdata Sample; groups with small sample size (fewer than 100 individuals) are excluded.
9 While our data do not allow differentiation between students of different ancestries within racial groups, these differences in nativity and immigration experiences are relevant, particularly within the Asian population. For example, Hmong households, many of whom are descended from refugees to the U.S., have a median income of $66,500, which is lower than the median income among all Asian households. In comparison, (Asian) Indian households, who are more likely to have immigrated for education or employment, have a median income of $110,000. (Authors’ calculation using 2014–2018 American Community Survey Public Use Microdata Sample).