Authors


Article Highlights
- Dashboard reflects collaboration with Itasca Project
- Progress on three key housing goals was barely on track in 2021
- Next to peer regions, Twin Cities area housing market both excels and lags
The increasing cost of housing—driven by too little housing supply relative to housing demand—threatens the vibrancy of the Twin Cities economy. That is the bottom line from the Itasca Housing Affordability Task Force Report published in September 2020. To address the threat, the report called for setting bold production goals for the housing market and tracking how the region performs against them. Fresh updates to a housing affordability data dashboard maintained by the Federal Reserve Bank of Minneapolis, in partnership with the Itasca Project, convey a mixed message on our collective progress.
The good news is that the region had a great year for new construction relative to the past. And relative to our peer regions, many of our housing market indicators look strong. However, while the production of housing that is affordable to lower-income households exceeded the 2021 goal, it was lower than production in 2020. And although Black homeownership is currently on track to reach 45 percent in 2030, it continues to lag White homeownership.
Explore the Regional Housing Affordability Dashboard
In addition to measuring progress against three regional housing affordability goals, the dashboard developed and maintained by the Minneapolis Fed monitors 10 housing-related indicators that reflect the full range of the housing market. It also provides context on how these outcomes vary across the Twin Cities region and compare to peer regions.
Even the good construction-related news comes with the knowledge that increasing interest rates and local policies that discourage new construction pose stiff headwinds to the ultimate solution to affordability concerns: growing our housing supply.
We describe this performance in more detail below, but the core lesson has not changed: leaders in the private, public, and nonprofit sectors must take collective action to increase the supply of housing in our region.
Ambitious goals, one year of progress
The Minneapolis Fed-Itasca Project’s Regional Housing Affordability Dashboard lists three ambitious goals in areas critical to maintaining housing affordability and the region’s relative economic prosperity:
- Supply 18,000 new housing units per year;
- Meet existing affordable production commitments of 2,090 new affordable housing units per year; and
- Match the national Black homeownership rate (45 percent in 2020) by 2030.
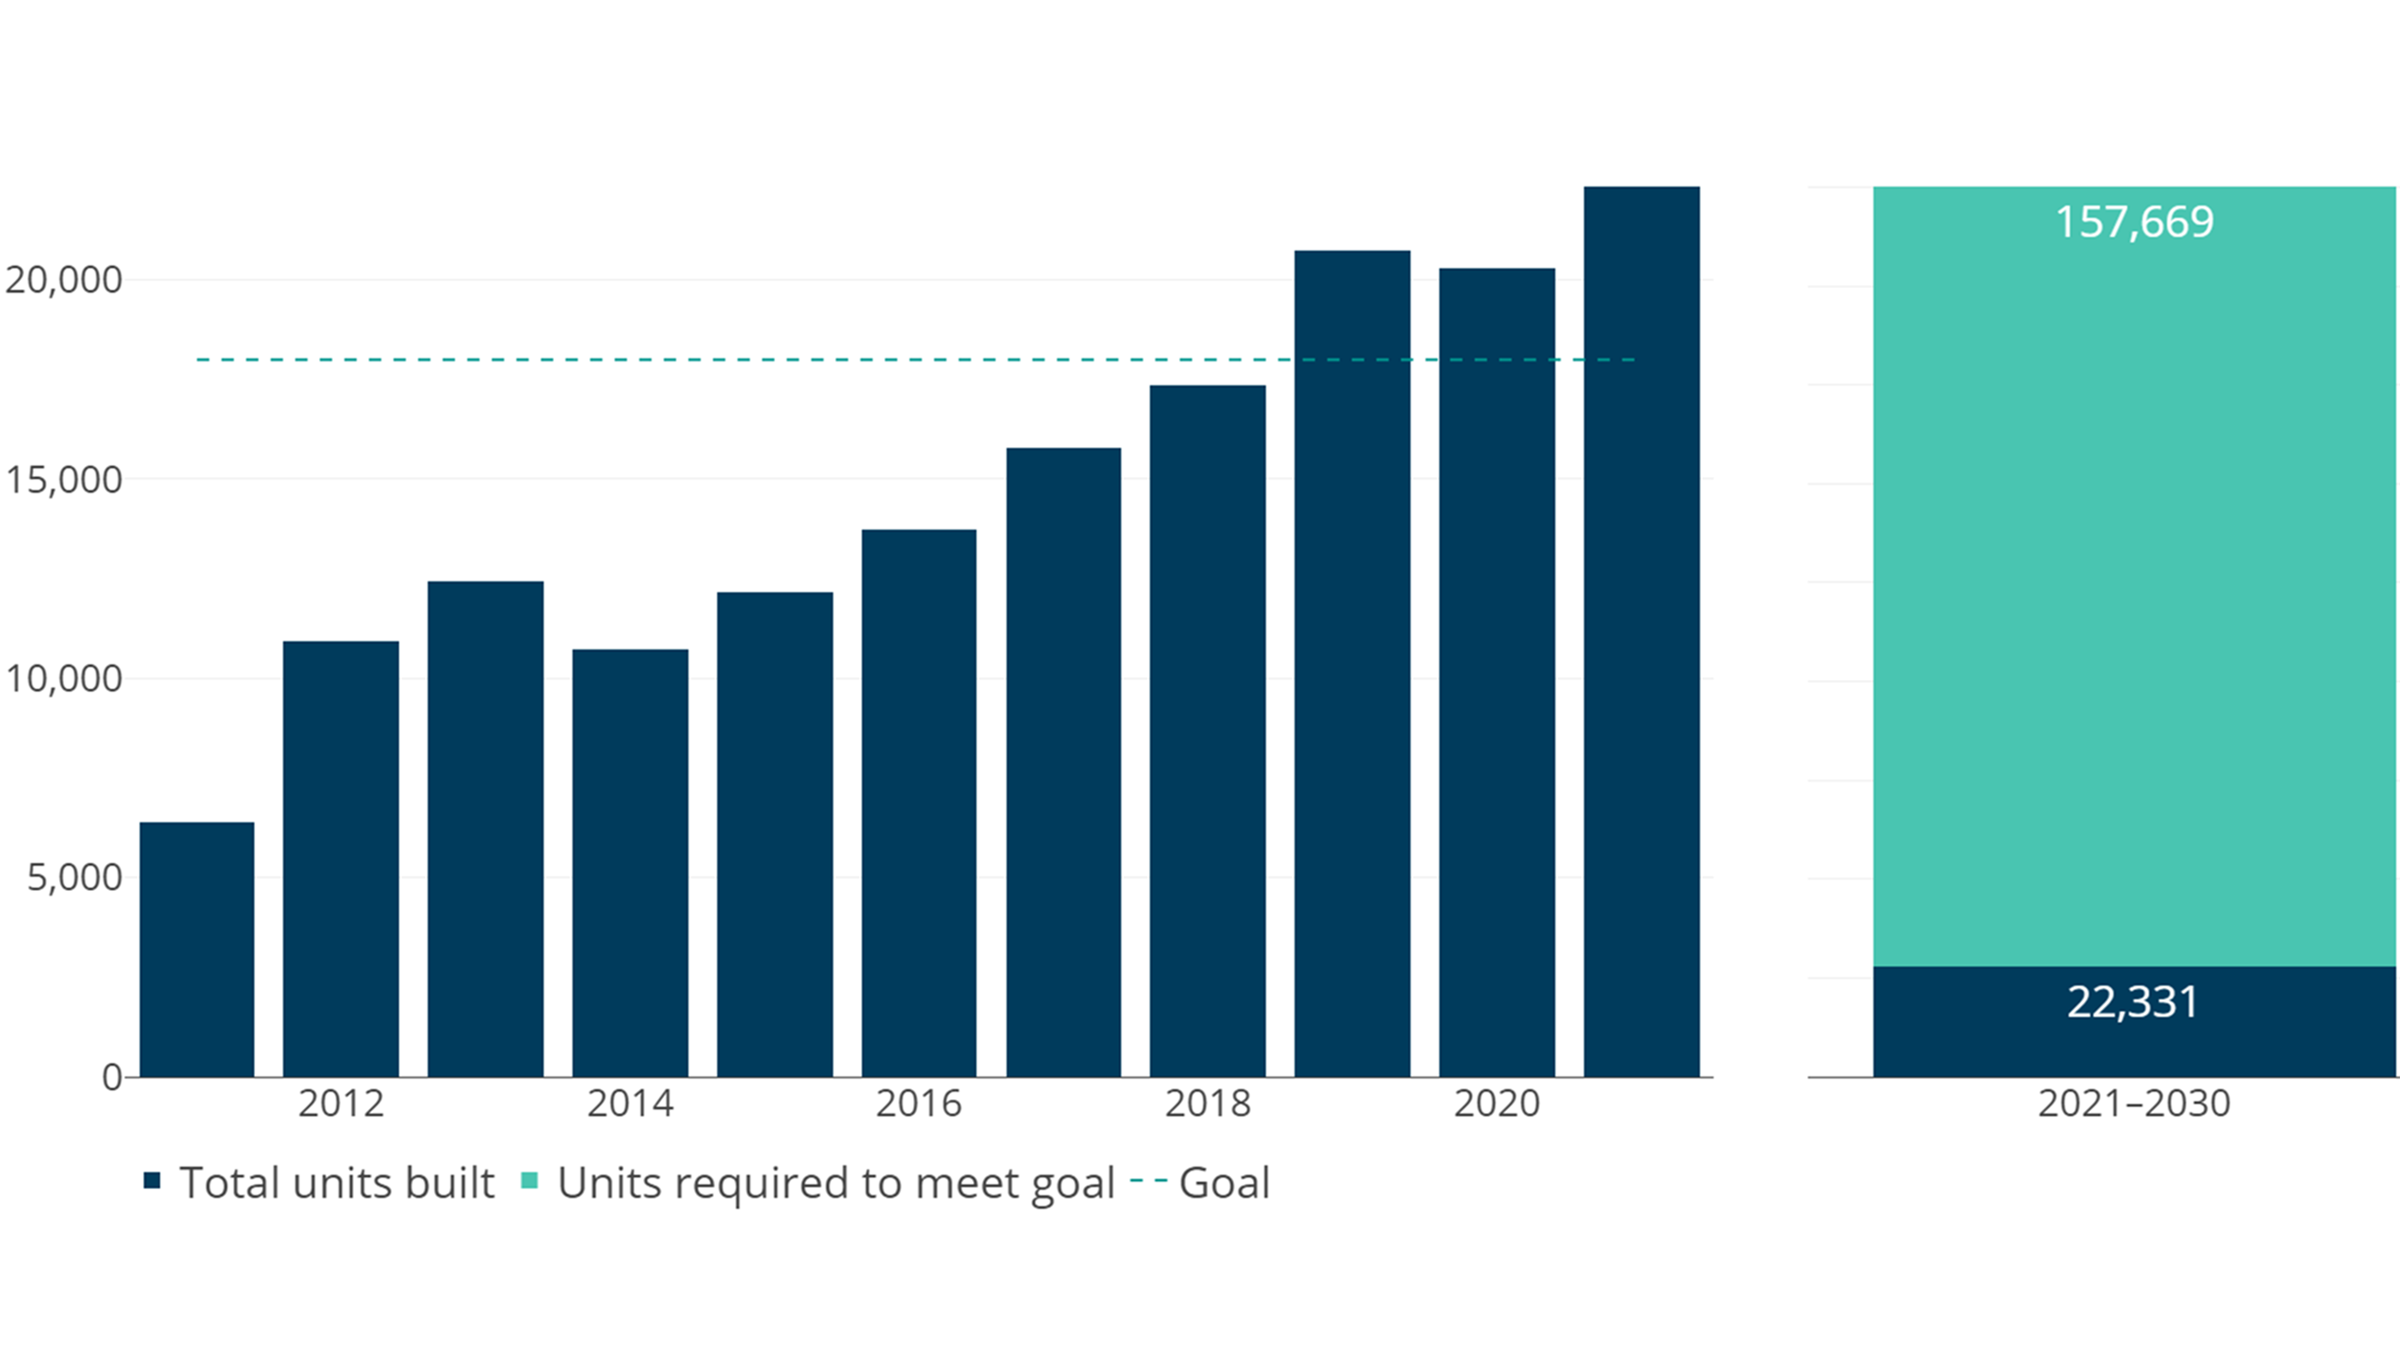
Supply 18,000 new housing units per year
The first goal challenges the seven-county Twin Cities region to add at least 18,000 new housing units each year. This goal represents the amount of housing needed to keep pace with a projected increase of 12,500 new households per year, account for lost housing units, erase the deficit of production left by the Great Recession, and provide enough cushion in housing supply to slow housing-price increases. Expanding the housing supply through new housing construction is the single most effective way to ensure long-term housing affordability.
In 2021, the region saw the highest-ever one-year count of permits at 22,331, culminating three consecutive years of the highest housing permitting on record. While these three years of strong production are critical, the region needs to see sustained construction to make up the gap. The volume of new supply is not sufficient to make a dent in rising housing costs; even with rising mortgage interest rates and a slowing market, the 12-month, rolling, median sales price calculated by the Minneapolis Area Realtors and Regional Multiple Listing Service of Minnesota still reached a new record high in August 2022.
Meet existing affordable production commitments of 2,090 new affordable housing units per year
The second goal focuses more narrowly on the supply of new affordable housing—that is, housing that costs at or below 30 percent of the income of a household that earns 60 percent of the area median income. Naturally occurring affordable housing—that is, unsubsidized housing that becomes less expensive to rent as existing units age—provides the largest share of affordable housing. Newly built affordable units, often built with substantial public subsidy, balance out losses in the affordable housing stock. Under the Livable Communities Act adopted by the State of Minnesota in 1995, the Metropolitan Council—the regional planning and policymaking agency for the Twin Cities area—negotiates goals with cities and sets an overall, area-wide goal. For the 2021 to 2030 decade, this goal equates to about 2,090 new affordable units a year.
While the region added more than 2,000 new affordable units in each of the last three years of the 2011–2020 decade, production remained well below what was necessary to address the need of 37,900 units over that decade, as estimated by the Metropolitan Council. Over the 2011–2020 decade, the region added 16,423 new affordable housing units, just over half the 2021–2020 goal of 30,600 new units. While 2020’s production of 2,724 new affordable housing units is nearly four times 2014’s nadir of 710 new units, production fell in 2021 to only 2,121 units. Ultimately, the challenges associated with building new affordable housing mean that overall new construction will be key. Recent research finds that creating new market-rate housing frees up existing units for lower-income households as relatively higher-income households move into new construction.
Match the national Black homeownership rate (45 percent in 2020) by 2030
The third goal calls the Twin Cities area to address its longstanding challenges in increasing homeownership among Black households. The Black homeownership rate in the Twin Cities area is one of the lowest in the nation, stagnating at only one in four Black households owning their home; in 2021, only 30.2 percent of Black households were homeowners. This means that Black households lose out on the many benefits of homeownership, including building wealth.
While our aspirational goal is to close the disparity in homeownership rates between Black households and White households, our interim goal is for the Twin Cities area’s Black homeownership rate to match the 2020 national Black homeownership rate of 45 percent by 2030. Reaching the 2030 percentage goal requires a net increase of 2,000 Black homeowners annually.
Comparing the Twin Cities area to peer regions
The prior section focused on performance against the three key goals. The dashboard also monitors a wider range of indicators relative to peer metropolitan statistical areas (MSAs); more precisely, it benchmarks the Minneapolis-St. Paul MSA against 11 peer regions identified by GREATER MSP, a regional, public-private economic partnership. This comparison reveals the strengths and challenges that characterize the regional housing market. Examining many of the dashboard’s indicators next to peer regions demonstrates the relative affordability of the Twin Cities housing market yet highlights areas where our region is severely underperforming, such as Black homeownership.
Rents in the Minneapolis-St. Paul MSA are the second-lowest of the peer regions after only Pittsburgh, and lowest relative to regional median household income. The Zillow Observed Rent Index for August 2022 pegged the Minneapolis-St. Paul MSA rent at $1,683, compared to $2,910 in Boston and $3,331 in San Francisco.
Only Pittsburgh has a higher share of rental units that are affordable to households earning 50 percent of area median income, and, at 55.3 percent in 2019 (the most recent data available), the Minneapolis-St. Paul MSA has more than twice the share of affordable rental units seen in less-affordable rental markets like Austin, Texas. Examining rental units affordable to households earning only 30 percent of area median income, the Minneapolis-St. Paul MSA has the third-highest, at 15.8 percent, lagging only Pittsburgh and Boston.
This relatively high share of affordable rental units helps drive the Minneapolis-St. Paul area’s relatively low share of households experiencing housing cost burden—that is, paying more than 30 percent of household income on housing costs. At 27.0 percent of households experiencing housing cost burden in 2021, the Twin Cities is second only to Pittsburgh and is more than 10 percentage points lower than San Francisco, the metro area with the highest cost burden, at 38.3 percent.
The comparative vitality of the Twin Cities housing market is further demonstrated by indicators of the homeownership market. The Minneapolis-St. Paul area has the second-lowest mortgage denial rate of the peer regions, lagging only Seattle, and at 5.3 percent in 2021 has less than half the denial rate seen in Austin (12.4 percent). Similarly, the Minneapolis-St. Paul area has a foreclosure rate of 0.24 percent of all active mortgages in June 2022, a level that is just over one-third the foreclosure rates found in Pittsburgh and Chicago.
Standing out among all the regions is the indicator where the Twin Cities area’s poor performance is in a class by itself: the disparity in the homeownership rates of Black and White households. In the most recent data, the region’s White homeownership rate surpassed the Black homeownership rate by 46.6 percent in 2021, nearly 8 percentage points more than the next-closest region, Pittsburgh (39.1 percent), and about twice the disparity of metro areas like Austin (24.2 percent) and Portland, Oregon (22.0 percent).
Learn more
The dashboard provides data broken out by race and income, and displays indicators across both time and space. The Minneapolis Fed updates the dashboard at least annually, with a handful of indicators updated more often.
Libby Starling is Senior Community Development Advisor in Community Development and Engagement at the Federal Reserve Bank of Minneapolis. She focuses on deepening the Bank’s understanding of housing affordability, concentrating on effective housing policies and practices that make a difference for low- and moderate-income families in the Ninth Federal Reserve District.