Authors

Natalie Gubbay
Research Associate, Institute


When Claudia Goldin won the Nobel prize in economics in 2023 for her research on women’s labor market outcomes, it was simultaneously cause to celebrate women’s progress toward economic equality and a sober reminder of how far there is to go. The gender gap in earnings closed significantly in the 1980s, but progress since has been slow, despite all the changes to the economic environment. In 2005, the median annual earnings of women was 69 percent that of men at the median. Fourteen years later, that number had inched up … to 74 percent. Put another way: A woman earning the median income of $38,060 in 2019 would need to increase her income by 35 percent to reach the median male income of $51,430, according to data from Income Distributions and Dynamics in America (IDDA), a new resource from the Opportunity & Inclusive Growth Institute and the U.S. Census Bureau.
“We’re often guilty of disregarding the enormous scale and long history of gender disparities,” Goldin wrote in her 2021 book Career & Family. The stickiness of the gender earnings gap is a reminder that for all the ink that has been spilled on the subject of income inequality in the United States, we have more hypotheses than conclusions when it comes to explaining the persistence of disparities.
In the case of the gender earnings gap, researchers have pointed to “greedy” jobs (Goldin’s term), nonwage amenities, the motherhood penalty, and salary histories as factors in women’s lives and the economy at large that shape women’s earnings. However, it’s difficult to test hypotheses about why women still earn only $0.74 for every $1 men do if that’s the only number we know. With so many potential contributing factors, we need more facts about incomes in America so we can do a better job identifying the causes of—and solutions to—income disparities.
Enter IDDA
By combining data from the IRS and the Census Bureau, IDDA statistics provide information on income levels and mobility for detailed demographic and geographic groups in the United States.
This means we can use IDDA to identify where income disparities are larger and smaller. Is the gender gap the same across the income distribution top to bottom, for instance? Do some states have much larger gaps than others? IDDA can shed light on these dynamics not only for men and women but also across states; by race and ethnicity; by age; and at the individual and household levels.
“Having data for 50 states helps us get a more nuanced picture of how incomes are evolving and gives us opportunities to test hypotheses about how local factors or policies might matter,” said Kevin Rinz, an economist at the Census Bureau and one of the principal investigators on the IDDA team. Data alone won’t automatically tell us what combination of economic factors and policies are causing income disparities. But when economic outcomes across states show varying degrees of success, that can be a starting point to identify where policies are working well and where they are not. On the other hand, consistency across states—and across time—might highlight patterns that are more deeply entrenched, requiring sustained national-level attention.
It is an ambitious and worthy goal to understand and address earnings gaps in the labor market. It’s one that requires data resources that are up to the task.
A gender gap that is not yet closed
Using annual earnings data from W-2 forms, IDDA shows where the earnings gap between men and women has closed the most—and where it remains wide.
A common way to measure the earnings gap is to compare the income distribution of men with the income distribution of women: If you line up all women in order of their earnings, how much are the women at the 10th percentile making? How much are the men making? This comparison shows that across most of the income distribution, women’s earnings in 2019 were between 70 and 74 percent of men’s (Figure 1). These values, called “relative earnings,” saw modest growth over the decade and a half from 2005 to 2019.
At the top of the income distribution is where the earnings gap widens. In 2019, men at the 98th percentile earned $293,400 while women at the 98th percentile earned $183,500, just 63 percent of men’s earnings. By the 99.9th percentile, women earned 46 percent of what men earned. While women’s earnings lag men’s across the income distribution, the particularly large disparity at the top suggests that obstacles to women’s employment in top executive positions and boardrooms—places where decisions impacting millions of U.S. workers are made—deserve more attention.
But relative earnings isn’t the only place where women lag men. While women make up half of all earners in the IDDA data, only 21 percent of the oft-discussed “top 1 percent” in 2019 were women—and of the total earnings received by that top 1 percent, women got 18 percent. While these proportions too look better in 2019 than in 2005, it is clear women are not getting an even slice of the pie.
One way to think about where the inequality comes from is to study what happens when the pie is growing. When the fraction of total income that goes to the top 1 percent increases, what happens to the share that goes to the women in the top 1 percent? It turns out, the fraction going to women increases less in years when the top 1 percent as a whole sees larger increases. In other words, growing the pie—at least for top earners—does not seem to translate to growing equality of earnings.
Mapping earnings gaps
There’s another intriguing dimension of variation in the gender gap: differences across states.
If the dozens and dozens of articles are any indication, Americans love ranking the 50 states. There are lists of the best states to live in and visit, states with the best education, even the states where people get the most sleep and which states are the most fun.
Perhaps state rankings intrigue us in part because the outcomes are not obvious. Which state would you guess has the highest relative earnings for women? The lowest?
Take a look at the map in Figure 2. Were you right?
The map highlights another insight from the IDDA data: The economic outlook for different demographic groups can look very different in neighboring states. Take Western neighbors Idaho and Nevada. At the median, women in Idaho earn just 64 percent of what men earn. In Nevada it’s 79 percent—15 percentage points more than across the border. This snapshot focuses on relative earnings at one point of the income distribution in two states, but the broader pattern holds: At the bottom of the income distribution and at the top, states vary by 20 percentage points or more when it comes to how much women earn relative to men.
This focus on states makes sense: States are important administrative units in the U.S., with considerable latitude to set a large number of policies that impact economic opportunity and outcomes. Eligibility for benefit programs, minimum wages, occupational licensing, housing regulations, sales taxes, and many public education programs are set at the state or local level, to name just a few. This policy variation provides an opportunity to investigate the impact of different policies on different groups—but doing so requires having robust income data for specific demographic groups within a state.
This is something datasets based on surveys are often unable to provide because they don’t have enough respondents in some demographic groups to generate representative data across the income distribution. The result is meaningfully different estimates of earnings inequality. As one example, IDDA estimates that at the 25th percentile, Black women in Michigan earned 80 percent of what White women earned in earned in 2018. The Current Population Survey, a standard survey data source, estimates this statistic at 94 percent. The difference in these values leads to different conclusions about the magnitude of inequality.
Intersecting identities, meaningful patterns
Of course, gender is just one characteristic that influences an individual’s experience in the labor market. Another dimension we know is important from decades of research on inequality is race and ethnicity. Because nearly two-thirds of women represented in the IDDA earnings data are White, the incomes of this group will drive average trends. But the states where women earn the most relative to men may or may not be the states where Black or Hispanic women are experiencing the greatest prosperity.
A simple bar chart shows how incomes by sex and race do not always move together, in absolute or relative terms. In 2019, Hispanic individuals made up more than 20 percent of the workforce in six states: Nevada, Arizona, Texas, California, Florida, and New Mexico. Figure 3 shows earnings at the median in those six states for Hispanic women, White women, Hispanic men, and White men. The median earnings of Hispanic women range from $23,600 to $27,970 in these states—not huge variation. The y-axis scale makes this range difficult to see, because it extends to almost three times the earnings of Hispanic women to accommodate the earnings of White men, which are considerably higher and show more variation.
The chart also indicates the earnings of Hispanic women, White women, and Hispanic men relative to those of White men in the same state. Looking at these percents, the states seem less similar to each other. In Texas, median earnings for Hispanic women was just 43 percent of the median for White men in 2019, the lowest ratio in any U.S. state. Relative earnings of Hispanic women in California was not much higher. On the other hand, median earnings for Hispanic women in Florida was 66 percent of median earnings for White men, the second highest in the country. Interestingly, White women have earnings similar to those of Hispanic men in these six states. In relative terms, Hispanic men do better in Florida; White women, in California.
Why might this information matter to more than those of us inclined to list-making? Local social service providers care who in their community has access to a minimum level of resources because such knowledge is critical to their work to alleviate poverty. These local inequalities also have direct implications for economic opportunity—where individuals can afford to live, whether they can buy a house, where they send their kids to school. Understanding what share of people lack those resources and who those people are can help providers target their efforts.
Relative earnings at this degree of granularity may also inform state lawmaking efforts to address inequalities. For instance, on January 1, a new law took effect in Minnesota that bans employers from asking for a job candidate’s salary history. Advocates of the law pointed to wage inequalities along racial, ethnic, and gender lines in the state. They argued that banning the question will make it more likely that workers are paid commensurately with their skill, not their demographics. In the future, granular income data may help policymakers and researchers assess whether the policy had an effect.
Meeting the promise of economic mobility
Economic mobility is a central promise of the American dream. Americans have long sought upward mobility by moving to states, regions, or neighborhoods where opportunities for growth seem to abound. Rural workers have sought higher earnings in cities. Between 1940 and 1970, more than 4 million Black Americans moved from the U.S. South into industrial cities in the North and West, a movement known as “the Great Migration.”
IDDA shows that movement up the income distribution from year to year does vary across states. From 2014 to 2019, the state with the least upward mobility was North Dakota, where 54 percent of individuals who started in the lowest quartile of earnings in 2014 and remained employed five years later had moved into a higher earnings quartile.
The state with the highest upward earnings mobility, meanwhile, was Utah, followed closely by its neighbors Idaho and Nevada. In Nevada, for example, 62 percent of individuals who started in the lowest earnings quartile had moved up. The 8 percentage point difference in upward mobility between North Dakota and Nevada translates to tens of thousands more workers who experienced movement up the income distribution. And that’s just one five-year window. Seemingly small differences in mobility can compound over time, affecting workers’ chances to get ahead—and the stability of their earnings once they do.
IDDA statistics also highlight that the role of race and sex in the labor market magnify differences in mobility. For example, about 64 percent of low-earning Asian workers in North Dakota saw mobility up from the lowest quartile, compared with 46 percent of low-earning American Indian or Alaska Native workers. And even in Nevada, just 54 percent of Black earners who started in the lowest earnings quartile in 2014 had moved into a higher quartile in 2019.
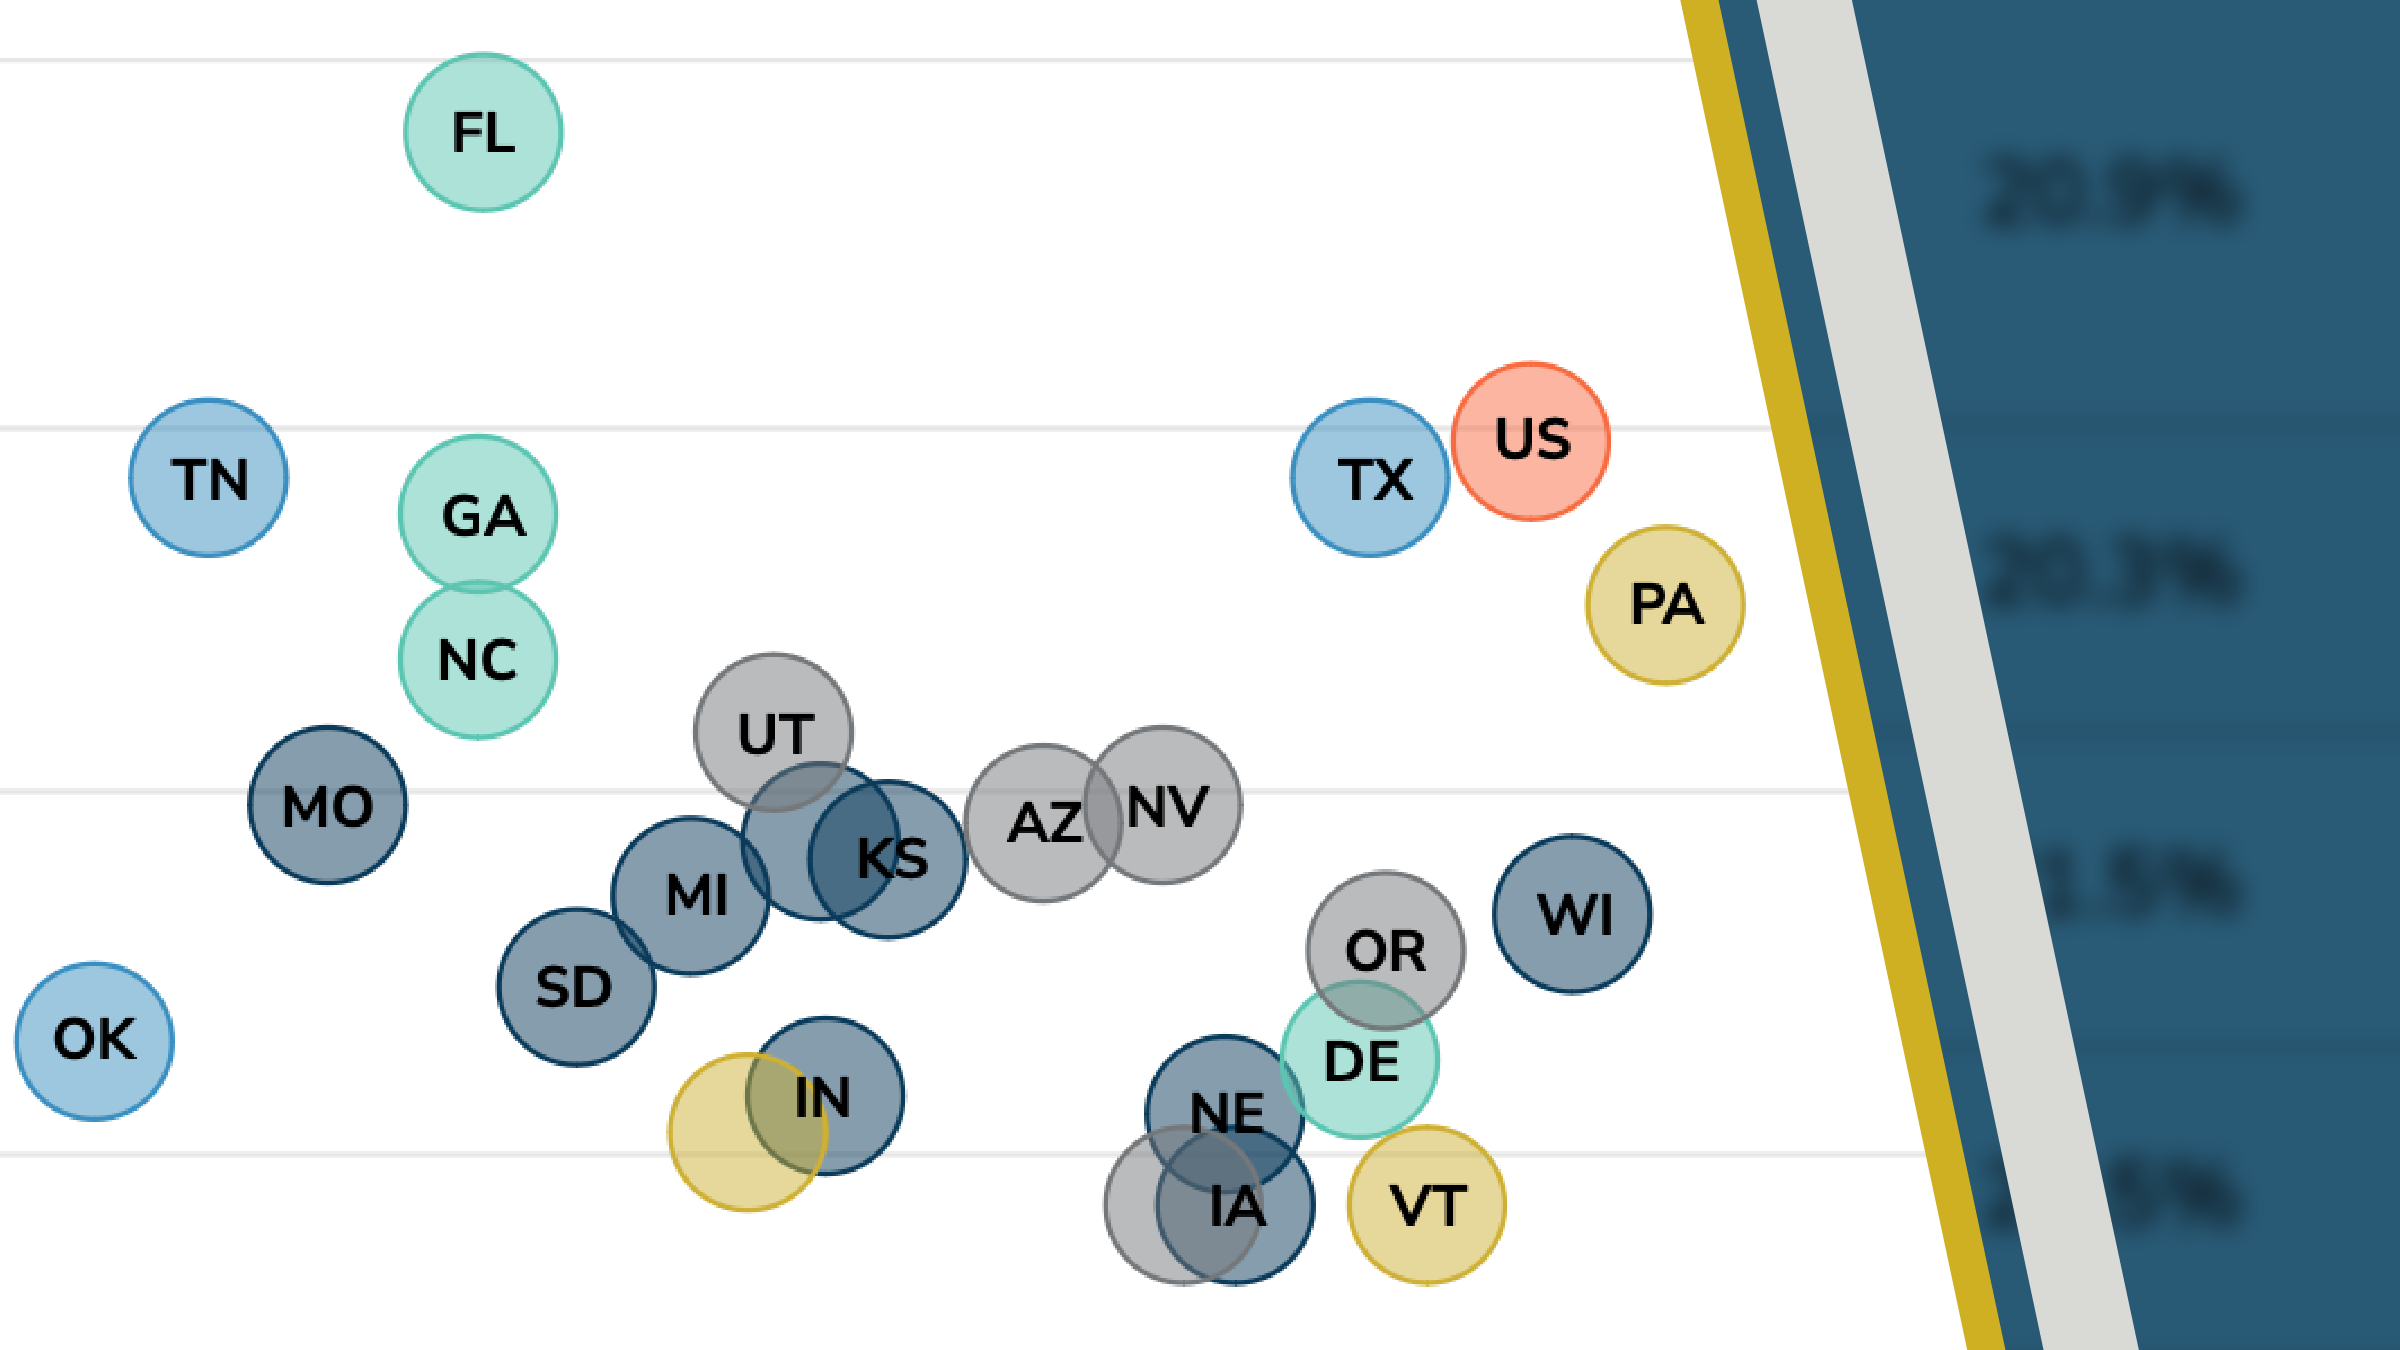
Figure 4 summarizes these comparisons, showing mobility rates across states for individuals starting in the lowest earnings quartile. Each dot represents a state. Dots that fall farther to the right highlight groups that experienced more upward mobility, while the spread of the dots indicates how much these rates varied across states. Hispanic and Asian earners experienced relatively high upward mobility over this recent time period, and that was true in almost all states.
Black and American Indian or Alaska Native earners saw lower rates of upward mobility than other groups. Black workers in the median state were less likely to move up in the earnings distribution than White workers in low-mobility states, for instance. And women saw less upward mobility than men.
How inclusive is income growth?
Another dimension to income inequality is the gap between those at the top and those at the bottom of the distribution. Have incomes grown by the same amount for everyone, or have some incomes grown faster than others?
Over the long term, there is little doubt. “While an awful lot has changed about America and the world since 1974, it sometimes seems that the biggest and most important change is the social fact of exploding income inequality,” the journalist David Wallace-Wells wrote in the New York Times at the end of 2023.
A lot of that explosion happened in the 1980s and ’90s. The trends in the two decades since then show both an acceleration and a deceleration—depending on what statistic you look at.
Between 2005 and 2018, individual earnings increased the most at the top and the bottom of the income distribution—by more than 20 percent, as the top chart in Figure 5 shows. Because the 10th percentile saw the most growth, earnings inequality between the 10th and 90th percentiles of the income distribution narrowed modestly.
But the picture looks different for household-level income. Individual earnings data in IDDA come from W-2 forms filed by employers, whereas household income data come from 1040 forms filed by individuals. The income reported on 1040 forms is summed for each address, so these values represent the resources available to individuals who share a residence.
Income growth across the distribution at the household level looks a lot more like conventional narratives about incomes in America: rapid growth at the top, near stagnation at the bottom. In fact, as the bottom chart in Figure 5 shows, income growth gets progressively larger the further up the household income distribution one falls.
According to research by Minneapolis Fed economists, this trend has long roots. “A household in the bottom 20 percent of the distribution now makes exactly the same as it was making 50 years ago, in real terms,” said Minneapolis Fed Monetary Advisor Fabrizio Perri. “That is super striking. Society has evolved a lot in 50 years—it’s become wealthier. But a household at the bottom makes the same.”
The statistics in IDDA confirm that income disparities in America remain wide. But IDDA’s granular data may help explain why different people have different impressions about the trajectory of incomes. We live our lives in households and local communities, not at a national median. Our age, sex, race, and ethnicity all play a role in the choices we face and the outcomes we experience, as do many other characteristics not captured in the Income Distributions and Dynamics in America statistics.
The magazine of the opportunity & Inclusive Growth institute
What IDDA does make clear is that relative incomes, income levels, and income mobility show incredible variation across places and across groups, producing a tapestry of income statistics as diverse as the country they reflect. At the end of the day, it is by seeking to collect and understand as many of these statistics as we can that we will be able to take more steps to foster prosperity and opportunity for all.
The opinions and conclusions expressed here are those of the authors and should not be interpreted as reflecting the views of the U.S. Census Bureau. The Census Bureau has ensured appropriate access and use of confidential data and has reviewed these results for disclosure avoidance protection (Project 7511151; Disclosure Authorization Numbers CBDRB-FY23-0277, CBDRB-FY23-0373, CBDRB-FY23-CES014-019, and CBDRB-FY23-CES014-016).
This article is featured in the spring 2024 issue of For All, the magazine of the Opportunity & Inclusive Growth Institute
Lisa Camner McKay is a senior writer with the Opportunity & Inclusive Growth Institute at the Minneapolis Fed. In this role, she creates content for diverse audiences in support of the Institute’s policy and research work.