Author

Steven Enfield
Supervisory Examiner
In this article, we will discuss Ninth District banks’ (primarily community banks) reliance on noninterest income and how it has changed over time.
Background
Bank profits are attributable to both interest (revenue earned from lending and investment securities) and noninterest (charges and fees) income. The interest margin banks earn by serving as the intermediary between depositors and borrowers continues to be the primary source of revenue for most financial institutions. However, banks also view noninterest income as a strategic line item on the income statement. When net interest margins are compressed and interest rates are low, banks seek other revenue streams such as noninterest income to boost profitability. Institutions charge fees that generate noninterest income as a way to increase revenue and ensure liquidity in the event of increased default rates. Banks also look to noninterest income because it may have traits different from interest income and could lead to lower risk through greater revenue diversification.
Sources of noninterest income
Banks earn noninterest income by charging for activities related to traditional banking services, such as taking deposits and processing transactions. In recent years, larger banks have also generated significant noninterest income from nontraditional activities such as investment banking, securities brokerage, underwriting, and mutual funds sales. However, nontraditional activities are not common among community banks.
In Call Reports, noninterest income for Ninth District banks is classified primarily into two segments: deposit service charges (monthly account, minimum balance, NSF, overdraft, ATM, stop payment, and returned item fees) and other noninterest income (credit-card-related fees, safe deposit box and safekeeping services, lending fees, cash management services, fiduciary account services, and insurance activities).
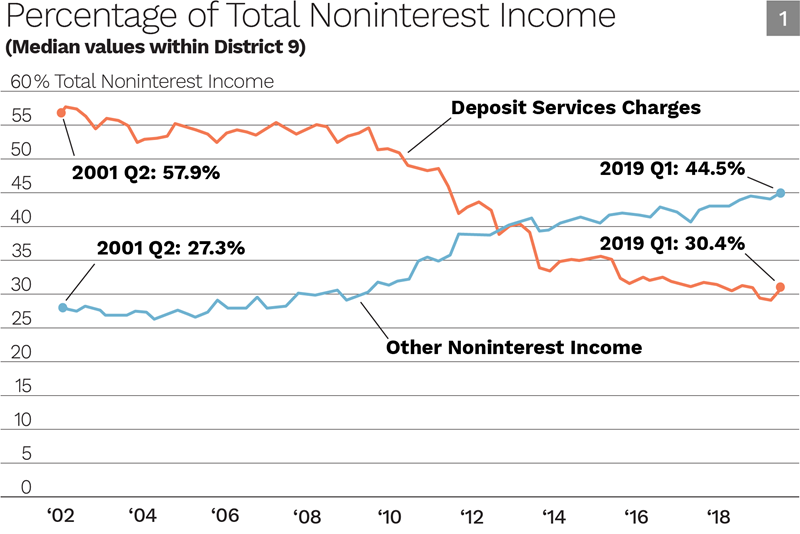
The relative contribution of the two segments of noninterest income to total noninterest income has changed over time for Ninth District banks. The contribution of deposit service charges has declined, whereas other noninterest income has increased. The nearly simultaneous changes in the regulatory environment and in macroeconomic conditions between 2009 and 2011 make it hard to determine the direct contributing factors for these changes. The factors contributing to reduced deposit service charges include regulatory changes, such as amendments to Regulation E, as well as changes in industry practices, such as time-order posting. The Regulation E amendments require customers to opt in to have overdraft coverage for their deposit accounts, which has resulted in fewer accounts with overdraft coverage and therefore reduced fee income. Transaction-posting practices changed from an approach based on transaction size (from highest to lowest) to processing of transactions chronologically, resulting in lower overdraft fees.
However, the increasing number of loan originations, credit card transactions, and debit interchange transactions all contribute to the continued growth of the other-noninterest-income segment since the recession. While the average debit interchange fee has declined due to implementation of the Durbin Amendment in 2012, the effect on institutions with less than $10 billion in total assets (a majority of Ninth District institutions) has been lower because debit interchange transactions at such banks are exempt from the fee cap.
Noninterest income trends

The time trend of the ratio of noninterest income to net income for the median firm shows that noninterest income accounted for about 50 percent of net income in 2001 and again in 2013. Since 2013, noninterest income has declined to 33 percent of net income. Banks continue to generate an increasing volume of noninterest income dollars (not shown). However, interest income has risen more rapidly due to loan growth as well as rising interest rates, resulting in a declining share for noninterest income.

An alternative way to look at Ninth District banks’ median noninterest income is to compare it with total revenue (interest income plus noninterest income plus realized gains/losses on securities), since net income can be significantly affected by expenses and income taxes. Noninterest income contributes modestly to total revenue. However, since 2013, the volume of noninterest income has increased at a slower rate than total revenues, which have outpaced noninterest income because of increased loan activity and rising interest rates.
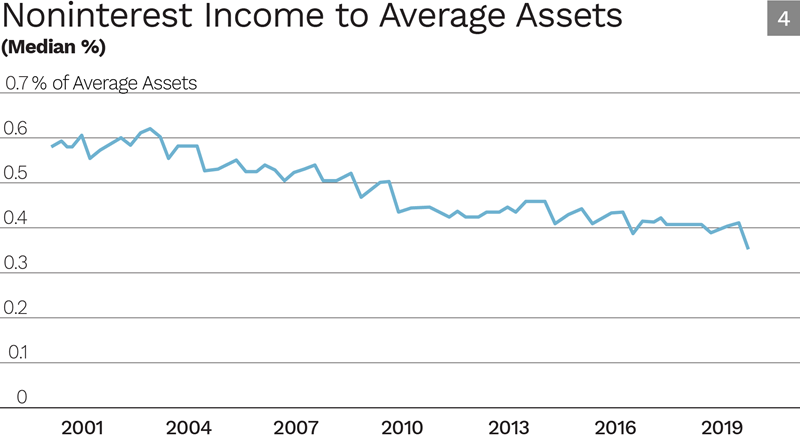
The ratio of noninterest income to average assets is less susceptible to economic cycles and therefore more suited to observing broader trends over time. Median noninterest income as a percentage of average assets has declined from 0.57 percent of total assets in Q1 2001 to 0.37 percent in Q1 2019, a 35 percent decline. However, the ratio remained relatively static from late 2000 to 2003 and again from late 2009 through 2014; these periods include recessions, when loans and consequently net interest income grow slowly or even shrink. This lack of sensitivity to the economic cycle and interest rates makes this income stream appealing to banks. Since 2014, as loans have continued to grow and interest rates have increased, noninterest income has been a less significant segment of total income.
Conclusion
The noncyclical nature of noninterest income enhances its appeal for community banks. This appeal is tempered by customer preference for lowered transaction costs and limited by consumer regulation in some areas. Noninterest income continues to contribute to the revenues at community banks, albeit at a lower level than in the past.