During the recent recession, employment across the nation fell by a misery-inducing 6.3 percent, the largest job decline in any postwar recession.
But “across the nation” masks a wide range of labor market conditions, depending upon where you live. Nevada experienced a staggering 12.9 percent decline in jobs from December 2007 to December 2009, while North Dakota posted a 1.7 percent increase. Likewise, employment dropped 61 percent in Loving County, Texas, while jobs increased 90.1 percent in Mercer County, Mo.
Is this but an economic crapshoot? What features might explain why some states, even some regions, did better or worse than others? Is it a matter of chance or economic destiny, at least in hindsight?
To answer these questions, the fedgazette looked at a number of economic features—income, education, poverty, industry mix, population, workforce participation and housing prices—across states, cities and counties prior to the recession. Those features were then analyzed for association with the subsequent job loss in those areas.
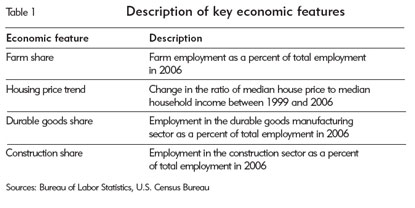
Four prerecession features jumped out as being significantly related to larger job losses during the recession: a small share of farm jobs, a large increase in housing prices, significant durable goods manufacturing and a large share of construction workers prior to the recession (see Table 1). These four features alone account for about half of the variability in employment loss across states and cities and about 20 percent across counties. (Full results of the regression analysis are available here.)
Ninth District results
These results help explain why every Ninth District state except Wisconsin had a smaller percentage of job loss than the national decline during the recession.
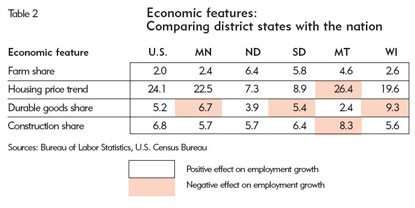
While there is wide variation among these four features across district states, there are similarities as well. Each state in the Ninth District had a larger farm share of employment than the national average in 2006 (see Table 2). All states, except Montana, saw a smaller increase in housing prices and a smaller construction share of employment.
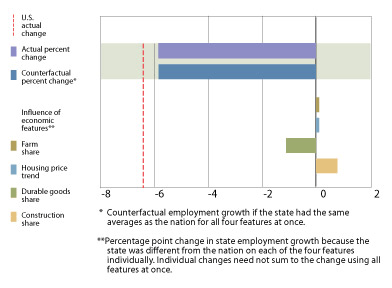
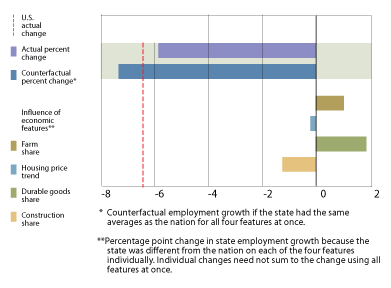
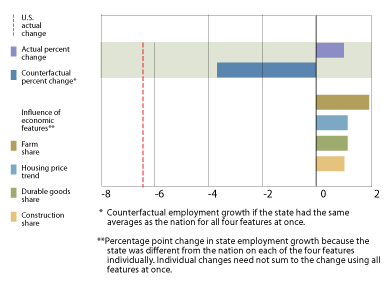
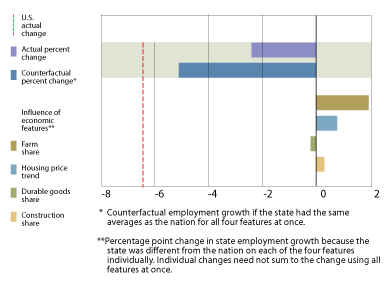
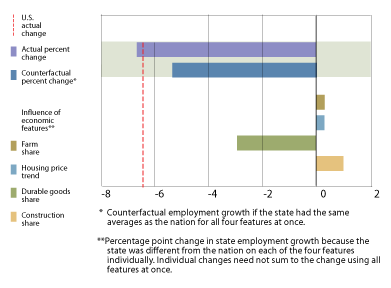
Another way of demonstrating the recessionary influence of these four features is to construct the counterfactual—what employment would have looked like had each district state mirrored the national average in farm jobs, median housing price increases, durable goods manufacturing and construction jobs (see charts below). Comparing the counterfactual with actual data highlights the unique composition of each district state relative to the U.S. economy and the associated influence of employment growth during the recession.
Employment change and influence of economic features
Dec. 2007 - Dec. 2009
Overall, North Dakota benefited the most from the differences in these four features relative to national averages. Had North Dakota looked like the nation, employment would have decreased 3.7 percent instead of increasing 1 percent. Roughly half of that difference (two percentage points) stems from the state’s large agricultural sector, which was relatively strong during the recession and acted as an employment buffer. South Dakota and Montana also had advantages, benefiting about 2 to 3 percentage points.
Meanwhile, the four features together had no impact on Minnesota employment. This result is consistent with past Minneapolis Fed research, including a June 2003 Region article noting that Minnesota has a similar composition to the U.S. economy and tends to move closely with it. Finally, Wisconsin was not able to offset its relatively large share of durable goods manufacturing with advantages among the other three features. Had Wisconsin’s composition looked like the nation, employment would have dropped 5.3 percent instead of 6.7 percent.
Across the district, the relatively large farm share helped each state, particularly Montana and the Dakotas. Smaller home price increases also helped district states, except Montana. Minnesota and Wisconsin were disadvantaged by their large share in durable goods manufacturing; South Dakota was affected only slightly. Meanwhile, a relatively small durable goods manufacturing sector in North Dakota and Montana served as a buffer in those states. Finally, most district states benefited from a smaller share of construction employment. The exception is Montana, which had a robust home building sector prior to the recession.
But every recession is unique, and these advantages might offer little help to district states in future recessions. Indeed, in previous recessions, the reliance on the farm economy has sometimes been a spear rather than a shield for district states. During the next recession, an entirely different set of sectors could suffer large employment losses or serve as protection against employment losses. Just as one cannot predict recessions, neither can one guess which economic features will help or hurt a state economy.


