
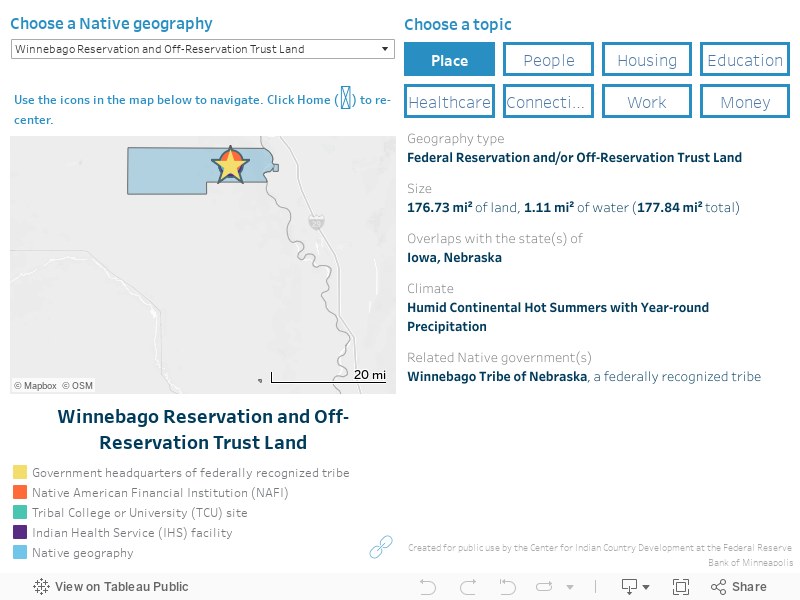
Information about our communities helps us tell our stories. The Native Community Data Profiles tool connects data from a variety of public sources for a place-based look at a range of topics. By helping to paint a holistic picture of Native communities and geographic areas, the tool aims to increase understanding of the rich variation across Indian Country and to support communities in telling their own stories.
To explore the tool, use the dropdown list to select a Native geography of interest. Then browse topics to view a variety of summary data on that place and the people who call it home. Hover over individual data points for additional explanation. To share or download information, use the tools at the bottom of the data window. Learn more about how you can use the tool in our related article.
Source and definition details are provided in About the Data. For trends over time, see our companion data resource Native Economic Trends. For an overview of historical and legal definitions of land areas associated with Indian Country, see What is Indian Country?
View the current source data. Download previous years’ data here.
Data notes
Demographic information reflects U.S. Census Bureau (Census) American Community Survey (ACS) five-year data products. Based on individuals’ self-reporting on the ACS, data are reported for the following categories:
- AIANa: American Indian or Alaska Native (AIAN) alone, with no other race self-identified;
- NHOPIa: Native Hawaiian and Other Pacific Islander (NHOPI) alone, with no other race self-identified;
- AIANac: AIAN alone or in combination with one or more other races; and
- NHOPIac: NHOPI alone or in combination with one or more other races.
A majority of Native census respondents self-identify as more than one race. Where possible, we use the broader AIANac and NHOPIac definitions.
Native communities are represented geographically using what Census defines as American Indian/Alaska Native/Native Hawaiian (AIANNH) Areas. This definition includes several types of Native geographies but does not comprehensively represent the locations of all Native communities. Another meaningful limitation is that because the measures displayed in the tool are geographically based, tribes not associated with at least one AIANNH Area are not shown. The Center for Indian Country Development (CICD) acknowledges that Native geographies tabulated by Census and displayed in this tool do not encompass all geographies having current or historical associations with Native nations.
For full details on how the information displayed in the tool is assembled, see About the Data. CICD plans to update this tool annually.