Author


Article Highlights
- Farm incomes decreased across district in third quarter with expectations for further decline
- Poorer financial conditions led to decreased loan repayments and higher loan demand amid modest drop in interest rates
- Land values increased on balance but were mixed across land types, while cash rents fell
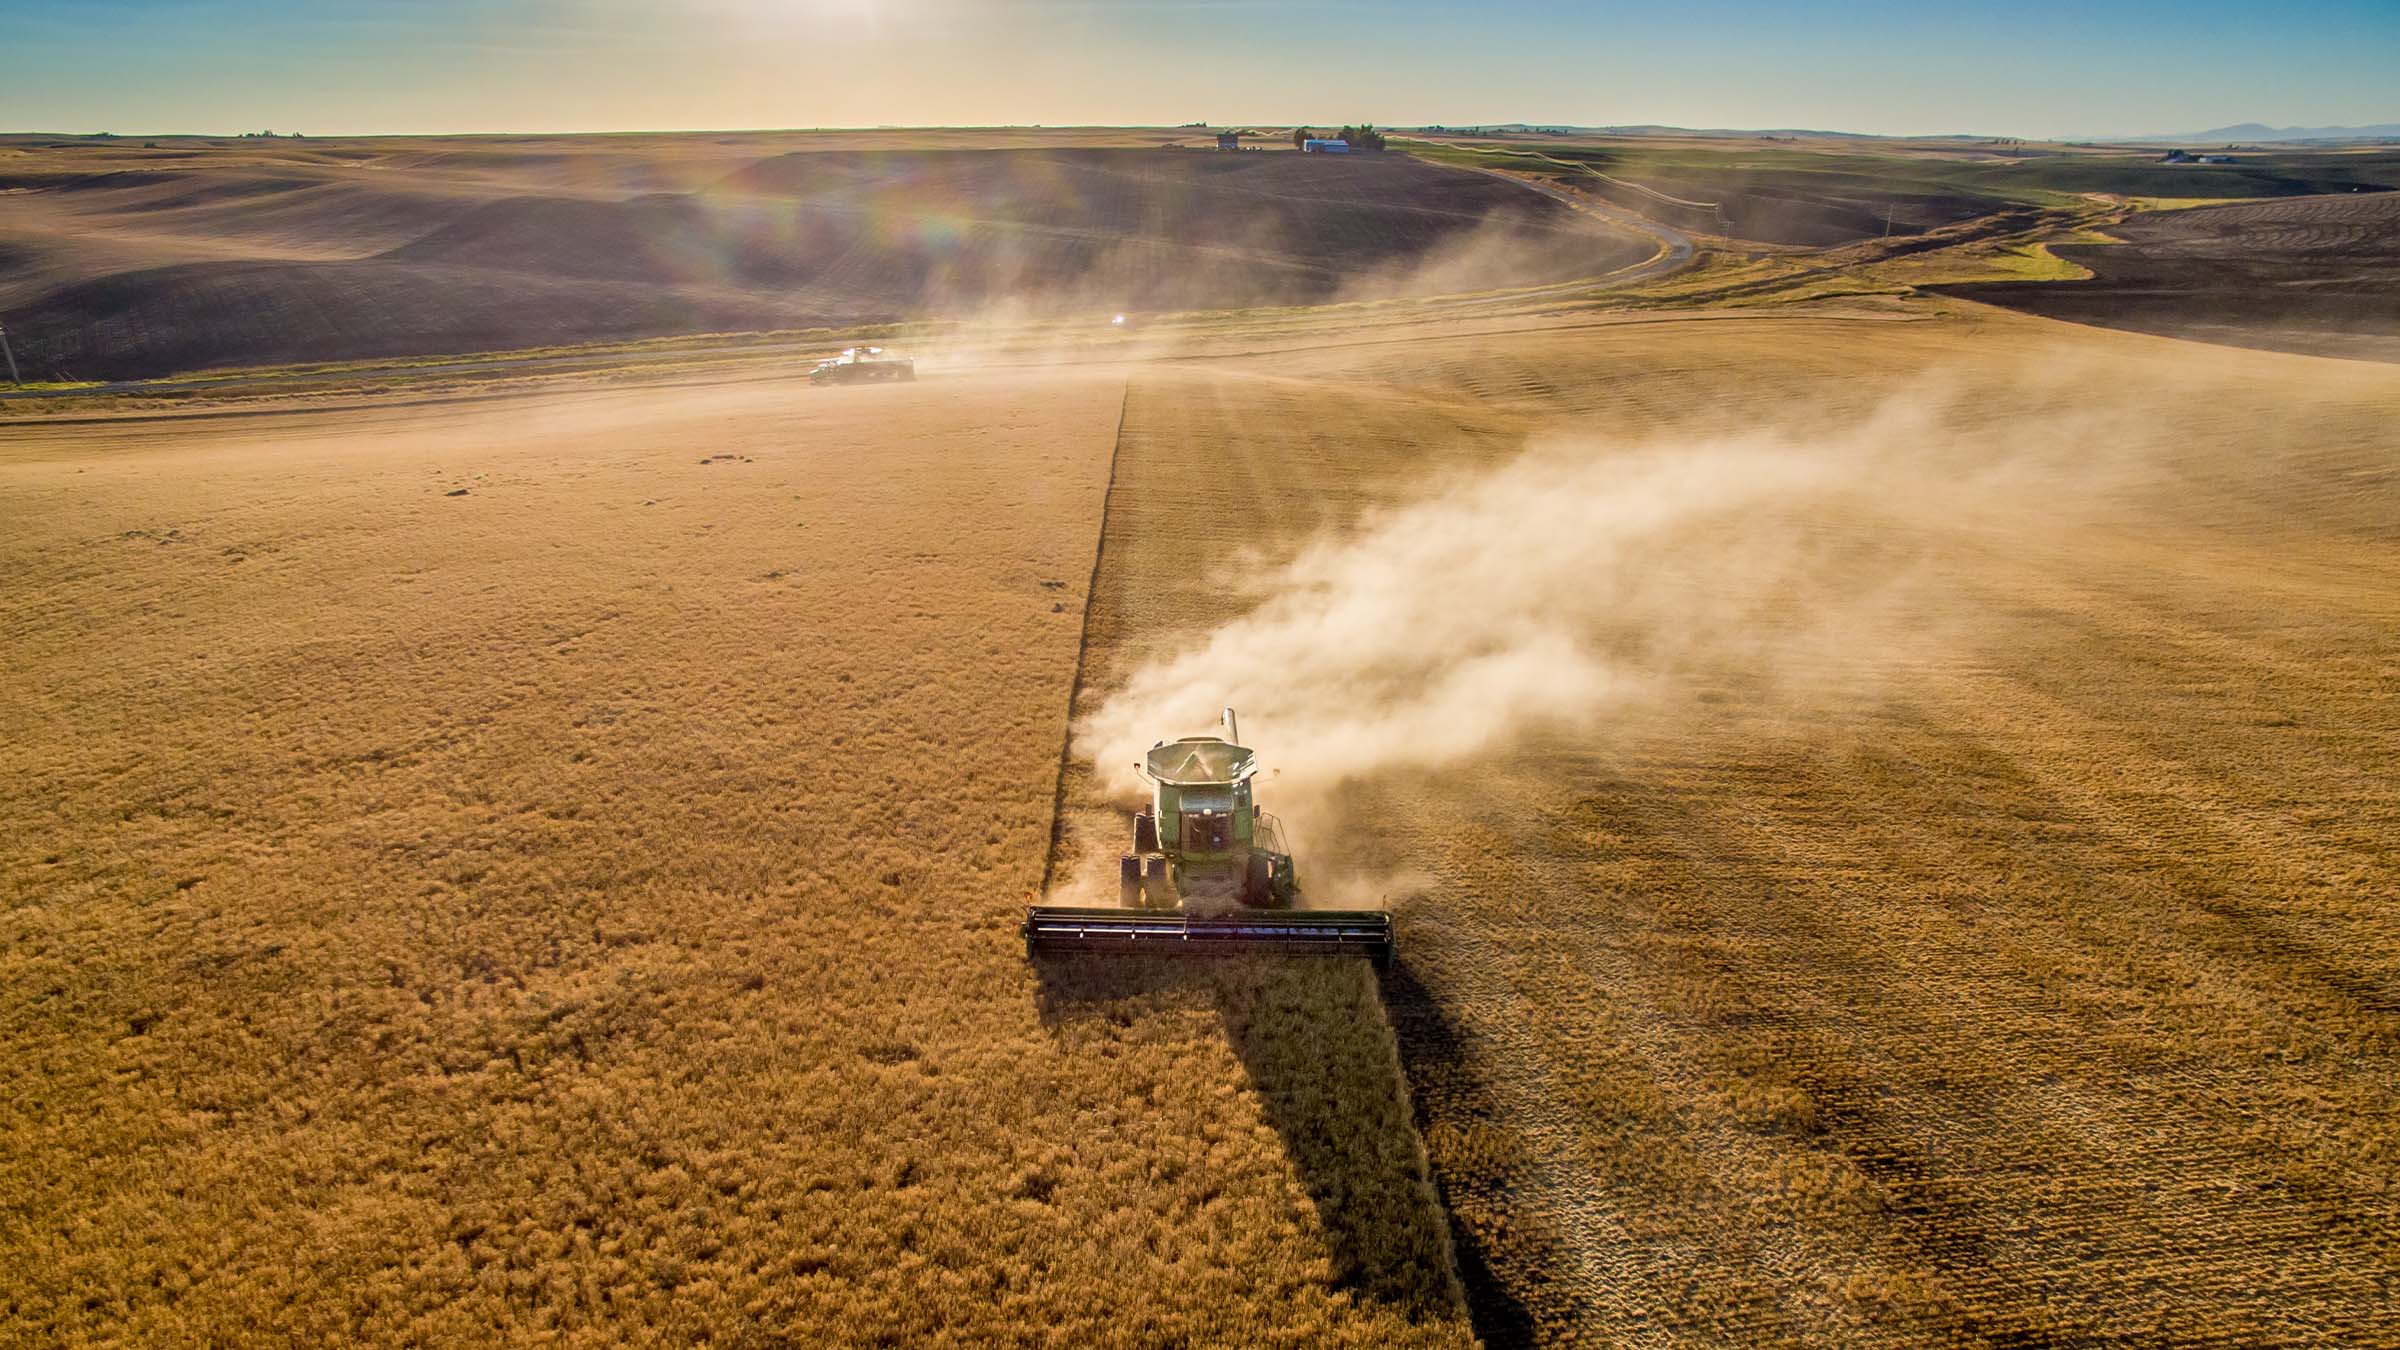
In most of the Ninth District, 2025 will go on the books as a strong year for crop production, even setting some records. But, according to an October survey of agricultural bankers by the Federal Reserve Bank of Minneapolis, those bountiful harvests are only a minor consolation to producers struggling with low commodity prices and uncertain international demand.
As a Minnesota banker commented, “Our crop yields will be good this year but because of crop prices our farmers are going to have a poor year.”
Farm incomes across the region fell compared with a year ago, according to the survey, which asked about agricultural conditions from July through September. Spending on capital equipment also fell, though farm household spending was only slightly lower on balance. Interest rates for agricultural loans dropped modestly, which, along with weaker income, pushed up demand for loans. Loan repayments also dropped, alongside an increase in loan renewal and extension activity. Cropland values increased overall from a year earlier across district states, while cash rents decreased slightly. The outlook for the fourth quarter was pessimistic, with survey respondents expecting a further decrease in incomes.
Farm income and spending
Bankers generally agreed that farm incomes decreased. Districtwide, 79 percent of agricultural lenders surveyed said incomes fell in the third quarter compared with the same period in 2024. Still, that number was a slight improvement over the previous quarter (see chart).
Strong cattle prices remained a source of strength. “Livestock producers are doing very well, grain farmers are struggling,” a Montana banker commented.
Capital expenditure also dropped, with 70 percent of respondents reporting decreased investment in equipment and buildings from a year ago, compared with 6 percent who reported increased spending. By contrast, spending by farm households was nearly flat on balance, with just over half of respondents reporting no change.
Loan demand and credit conditions
Farm finances deteriorated as a result of continued weakness in cash flows. Demand for loans increased from a year earlier for 43 percent of lenders, compared with 17 percent who reported lower loan demand. As a result, 47 percent also saw an increase in loan renewals or extensions; only 2 percent saw a decline.
Farm borrowers received some relief thanks to falling interest rates. Fixed and variable rates on operating, machinery, and real estate loans decreased modestly in the third quarter. Yet nearly half of lenders (49 percent) indicated that the rate of repayment on agricultural loans fell relative to a year ago, and an equal share said repayment was unchanged. Collateral requirements don’t tend to change quickly, but sagging balance sheets appear to be having an impact, as 17 percent of respondents said they increased collateral requirements. Only 2 percent of banks reported having refused a loan due to a shortage of funds.
Cash rents and land values
Even amid weaker farm finances, farmland values have held up better recently. That’s because land values are driven by longer-run factors in the economics of farming than year-to-year swings in income. Though rising farmland values have been the trend over the last five years, the picture became more mixed in the third quarter this year. Ninth District nonirrigated cropland values increased by 4 percent on average from the third quarter of 2024. Irrigated cropland values were roughly flat, rising by less than 1 percent from the same period last year, while ranch- and pastureland values decreased by more than 4 percent.
In contrast to land values, the cash rents paid by producers to owners of land are more sensitive to the incomes that can be earned from it. And in reflection of weaker farm incomes, the district average cash rent for nonirrigated land fell by almost 1 percent from a year ago, and irrigated land rents fell by slightly more than 1 percent. Meanwhile, with livestock production more profitable than farming, ranchland rents increased 5 percent.
Outlook
The outlook for agriculture over the remainder of 2025 was mostly pessimistic. Roughly 83 percent of respondents expected that farm incomes will decrease in the fourth quarter of 2025 compared with the fourth quarter of 2024, and 11 percent expected incomes will increase. Lender expectations for farm capital spending were also contractionary, and household spending was expected to fall given persistently lower incomes for several years. More than half of lenders expected loan demand to increase, while 62 percent of respondents expected the rate of repayment to decrease further. Still only a few anticipated referring any loans to credit agencies.
While the longer-term outlook heavily depends on international and market developments, a Minnesota lender offered a foreboding assessment: “If conditions continue to deteriorate on the price side there will be producers unable to farm next year.”
| MN | MT | ND | SD | WI | Ninth District | |
|---|---|---|---|---|---|---|
| Percent of respondents who reported decreased levels for the past three months compared with the same period last year: | ||||||
| Rate of loan repayments | 73 | 20 | 50 | 25 | 67 | 49 |
| Net farm income | 87 | 40 | 92 | 75 | 67 | 79 |
| Farm household spending | 33 | – | 42 | 17 | – | 26 |
| Farm capital spending | 87 | 40 | 67 | 67 | 33 | 70 |
| Loan demand | 13 | – | 33 | 8 | 33 | 17 |
| Percent of respondents who reported increased levels for the past three months compared with the same period last year: | ||||||
| Loan renewals or extensions | 47 | 20 | 67 | 33 | 67 | 47 |
| Referrals to other lenders | 14 | – | – | – | – | 5 |
| Amount of collateral required | 13 | 20 | 17 | 8 | 67 | 17 |
| Loan demand | 67 | 40 | 33 | 25 | 33 | 43 |
| MN | MT | ND | SD | WI | Ninth District | |
|---|---|---|---|---|---|---|
| Percent of respondents who expect decreased levels for the next three months: | ||||||
| Rate of loan repayments | 73 | 20 | 75 | 42 | 100 | 62 |
| Net farm income | 87 | 60 | 92 | 75 | 100 | 83 |
| Farm household spending | 53 | – | 42 | 42 | – | 38 |
| Farm capital spending | 93 | 40 | 67 | 67 | 100 | 74 |
| Loan demand | 20 | – | 25 | – | – | 13 |
| Percent of respondents who expect increased levels for the next three months: | ||||||
| Loan renewals or extensions | 57 | 40 | 75 | 42 | 100 | 59 |
| Referrals to other lenders | 14 | – | – | 8 | 33 | 9 |
| Amount of collateral required | 33 | 40 | 17 | 17 | 100 | 30 |
| Loan demand | 67 | 60 | 58 | 42 | 67 | 57 |
| Operating | Machinery | Real estate | |||||
|---|---|---|---|---|---|---|---|
| Fixed | Var. | Fixed | Var. | Fixed | Var. | ||
| Q4 2023 | January | 8.8 | 8.7 | 8.3 | 8.3 | 8.0 | 8.0 |
| Q1 2024 | April | 8.6 | 8.6 | 8.2 | 8.4 | 7.9 | 8.0 |
| Q2 2024 | July | 8.8 | 8.7 | 8.4 | 8.5 | 8.0 | 8.1 |
| Q3 2024 | October | 8.7 | 8.7 | 8.3 | 8.4 | 7.8 | 8.0 |
| Q4 2024 | January | 8.2 | 8.1 | 7.9 | 8.0 | 7.6 | 7.6 |
| Q1 2025 | April | 7.9 | 7.9 | 7.7 | 7.8 | 7.4 | 7.4 |
| Q2 2025 | July | 7.9 | 7.9 | 7.6 | 7.6 | 7.3 | 7.3 |
| Q3 2025 | October | 7.7 | 7.7 | 7.5 | 7.5 | 7.1 | 7.0 |
Joe Mahon is a Minneapolis Fed regional outreach director. Joe’s primary responsibilities involve tracking several sectors of the Ninth District economy, including agriculture, manufacturing, energy, and mining.


