Authors

Nicole Busker
St. Catherine University
Deborah Rho, PhD
University of St. Thomas
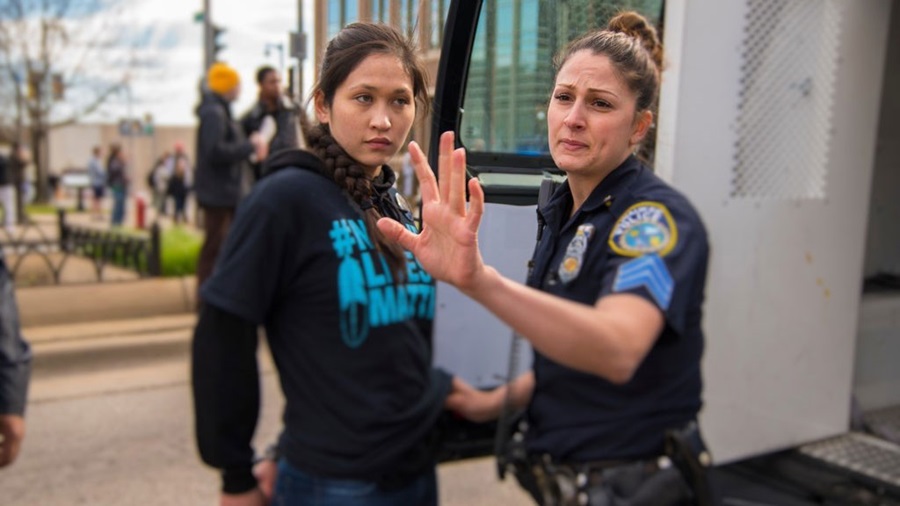
Photo by Joe Brusky Photography
The Minneapolis Police Department stopped, searched, and arrested American Indian women much more frequently than other women, according to data the Minneapolis Police department has released on each police stop.1
American Indian women comprise 1.42% of the population of women in Minneapolis, but accounted for 6.57% of police stops of women taking place in Minneapolis (including traffic stops and non-vehicle stops) from November 1, 2016, through October 19, 2017. After they were stopped, 27% of American Indian women were searched, while white women were only searched 6% of the time. These police stops concluded with 20% American Indian women being arrested and booked, compared to only 4% of white women.
These statistics likely reflect a complicated interplay of underlying factors, and these facts alone do not imply biased or inappropriate police conduct. Nonetheless, these differences are striking and of policy interest. For example, being arrested may affect family stability, employability, and income. We intend to continue research into the factors behind racial differences in stops, searches, and arrests in Minneapolis.
Police disproportionately stop American Indian women
1.42% of women in Minneapolis report their race as American Indian or Alaska Native,2 but for our data period the Minneapolis police report that 6.57% of their stops of women were Native American. This is a ratio of 4.63, meaning that American Indian women were stopped by police 4.63 times as often as they would be if their stops were proportional to their share in the city’s female population3. The ratio for American Indian men was 2.23 (3.37% of stops of men, but 1.51% of the male population). This suggests that American Indian men were also disproportionately stopped, but less disproportionately than American Indian women. The ratio for African American men was 2.55 (48.7% of stops, but 19.1% of the male population). Of all the races reported by the police, American Indian women were the most disproportionally stopped in Minneapolis.
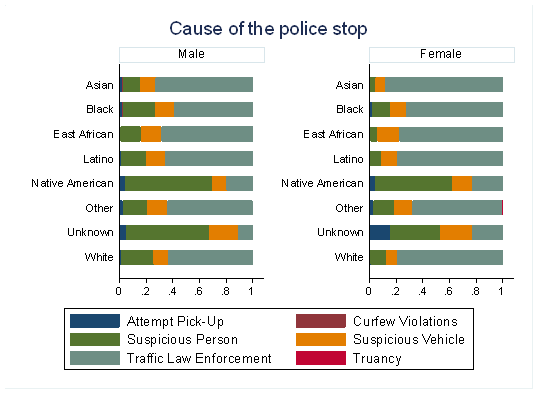
As shown in the following graph, the majority of stops in Minneapolis were for traffic enforcement. However, the majority of stops of Native Americans were logged as a “Suspicious person.”
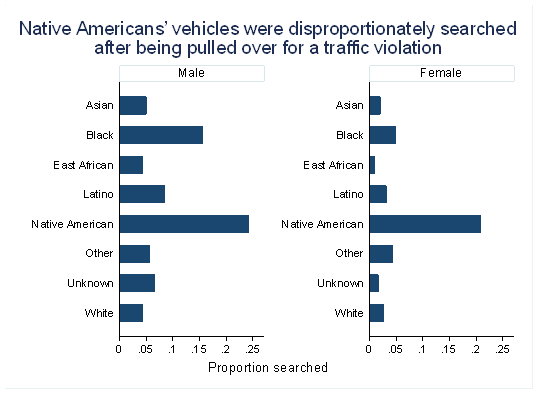
Once stopped, police search and arrest Native Americans more often than any other group
After police officers initiated a stop, the stop often proceeded in a very different way for American Indian men and women than for people of other races. After a stop begins, the police officer may choose to perform a search of the person and/or the vehicle. As shown in the figures below, Minneapolis police searched Native American men and women and their vehicles more often than any other race.

Most police stops end with the police officer advising or warning the person who was stopped. Sometimes, the stop ends with the person being arrested and taken to booking. Twenty percent of stops of Native Americans result in an arrest—over twice as often as any other race.

To examine whether the disproportionate searches and arrests of American Indian women were driven by other characteristics – for example, where the stop happens, the time of the stop, and the “problem” of the stop – we examine differences in searches and arrests after controlling for these factors. In the following table, the first column for each outcome variable shows the raw difference, and the second column shows the difference after adjusting for these factors. For example, Native American women were searched 19.6 percentage points more often than women of other races. After controlling for location, time, and problem of the stop, Native American women were still searched 10.9 percentage points more often than women of other races. As the table shows, the differences in searches and arrests persist, even after accounting for these other important variables.
| Person searched | Vehicle searched | Booked | ||||
|---|---|---|---|---|---|---|
| Native American | 0.196*** (0.019) |
0.109*** (0.022) |
0.061*** (0.011) |
0.080*** (0.014) |
0.151*** (0.016) |
0.109*** (0.020) |
| Controls? | No | Yes | No | Yes | No | Yes |
| R-squared | 0.031 | 0.120 | 0.005 | 0.068 | 0.026 | 0.086 |
Linear probability model. Robust standard errors in parentheses, clustered by neighborhood.
Controls include neighborhood fixed effects, “problem” of the search, hour of the day, and month of the year. N=9,333 (stops of women with information on the control varialbes)
*** p<0.01, ** p<0.05, * p<0.1
Stops of American Indian women were concentrated in south Minneapolis
There was a striking geographic pattern of police stops of American Indian women. Most stops for Native Americans happened in the third police precinct, and stops of Native American women were particularly concentrated in East Phillips and Midtown Phillips. In fact, over 40% of women stopped in East Phillips and Midtown Phillips were Native American.
Within south Minneapolis, many stops of American Indian women occurred on Lake Street. The following heat map4 of south Minneapolis shows the geographic concentration of stops of American Indian women.
Map of south Minneapolis showing where Native American women were stopped

“Hotter” colors, like orange and red, represent areas with the highest number of stops. Green highlights areas with a moderate number of stops. Areas with no color are places where few or no stops occurred.
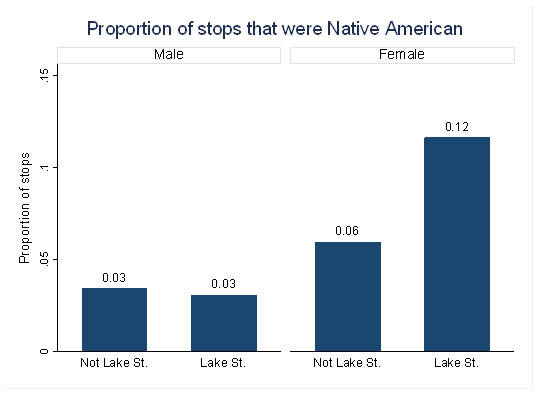
Of all women stopped on Lake Street, 12% were Native American. For the rest of Minneapolis, 6% of women stopped were Native American. This striking difference does not occur for Native American men.
Conclusions and future research
Nationally, 32% of Native Americans report that they are excessively stopped and unfairly treated by the police.5 Our analysis of recent data shows that Minneapolis police disproportionately stopped American Indian women in Minneapolis, primarily due to stops for being a “Suspicious person.” After being stopped, American Indian women also were far more likely to be searched and arrested, even after adjusting for the location, time, and problem that triggered the stop.
A striking result of this analysis is that stops of American Indian women were highly concentrated in Midtown Phillips and East Phillips, particularly along Lake Street. This pattern does not occur for men, suggesting distinct factors underlie the inequalities for Native American women.
We will continue to investigate this striking disparity facing American Indian women in Minneapolis.
For questions regarding the study or methodology, please contact Dr. Marina Gorsuch at mmgorsuch952@stkate.edu or Dr. Deborah Rho at deborah.rho@stthomas.edu.
Endnotes
1 The Minneapolis Police Department has publicly released data on every stop made by the department. The officer enters data about the race and gender of the person they have stopped, the problem that triggered the stop, if the person was searched, if a vehicle was searched, if the person was issued a citation or booked after the stop, the precinct that it took place in including the approximate latitude and longitude of the stop, and the date and time of the stop. The race included in the data is described as “the determined racial makeup of the subject of the incident.” It is unclear if this is the subject’s self-described race or the officer’s perception of the subject’s race.
This analysis uses data from November 1, 2016, to October 19, 2017, which included 33,931 stops that have a race and gender. Data are available at http://opendata.minneapolismn.gov/datasets/police-stop-data
2 Estimate based on IPUMS ACS 2016. Steven Ruggles, Katie Genadek, Ronald Goeken, Josiah Grover, and Matthew Sobek. Integrated Public Use Microdata Series: Version 7.0 [dataset]. Minneapolis: University of Minnesota, 2017.
3 Overall men were much more likely to be stopped by police than women (73% of stops were of men). Because of this large disparity, these ratios are calculated within sex. Essentially, this calculation takes the gender difference as given and calculates the disparity based on the existing gender breakdown of stops.
4 The latitude and longitude are approximate, so do not exactly reflect the stop’s location. The latitude and longitude are altered slightly by the police department to anonymize the data.
5 “Discrimination in America: Experiences and Views of Native Americans” NPR, Robert Wood Johnson Foundation, and Harvard T.H. Chan School of Public Health (2017)