
Ninth District
The commercial real estate (CRE) loan portfolio represents a major line of business for many banks across the nation. In the Ninth District, CRE accounts for at least one of every eight loan dollars, as of the first quarter of 2018 (also referred to here as the current quarter). CRE loans—usually secured by real estate—include construction, land development, and the purchase of buildings such as offices, hotels, hospitals, and medium to large apartment buildings. CRE loans are prone to risk, and therefore examiners regularly assess the size and quality of this portfolio for banking institutions and start by using a test to judge whether to classify a bank as CRE concentrated.
Recent media stories have questioned the health of the portfolio as well as banks’ appetite for this type of lending at the national level. In this article, we discuss how the CRE portfolio in the Ninth District has grown in recent years, and we assess its quality by exploring the level of delinquencies in the portfolio. We compare this result with national trends. The regulatory definition of CRE concentration applies to banks that do a large amount of CRE lending relative to their risk-based capital. We will look at how CRE concentrated banks have behaved between 2004 and 2018.
CRE concentration
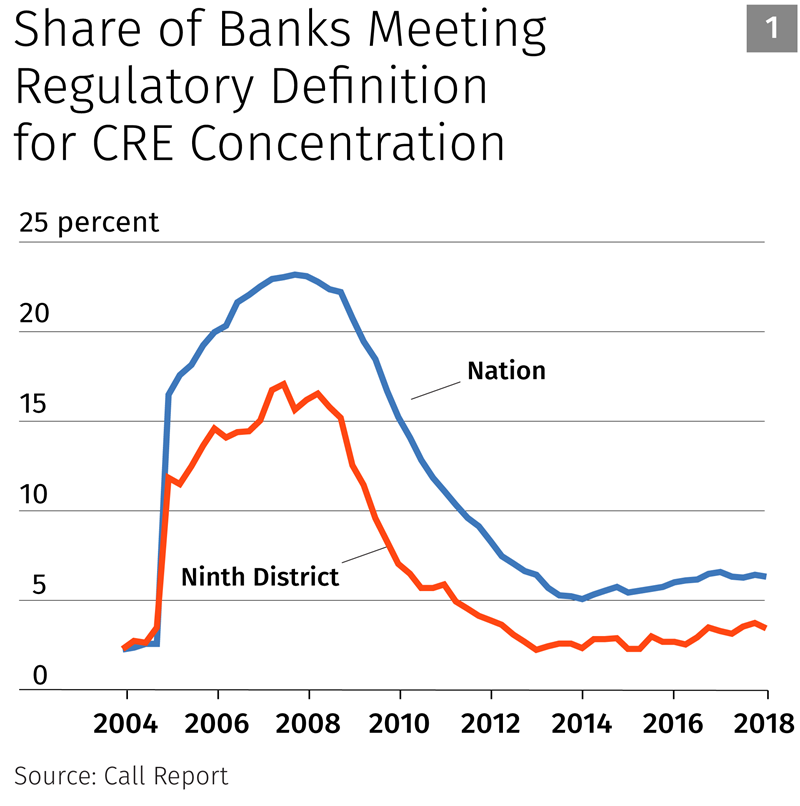
Supervisors perform a quantitative test (see SR 07-1 for details) to determine whether CRE loans make up a large share of a bank’s overall lending activity; banks meeting this criterion are designated as CRE concentrated. If the total amount of construction and land development (CLD) loans at an institution is greater than the amount of risk-based capital, the bank is classified as CRE concentrated. If it is not greater, the second criterion for being CRE concentrated requires that the CRE portfolio be greater than 300 percent of the firm’s capital and that the portfolio has grown more than 50 percent over the past three years. In the current quarter, 18 of the 538 firms in the District meet the regulatory definition of CRE concentration. Historically, the District share of CRE concentrated banks has been 4 percent to 5 percent lower than the national average. The share of banks meeting the regulatory definition for CRE concentration has slowly risen since 2013. However, the current share is still less than one-third of the peak shares in the run-up to the financial crisis.
CRE composition and growth rates
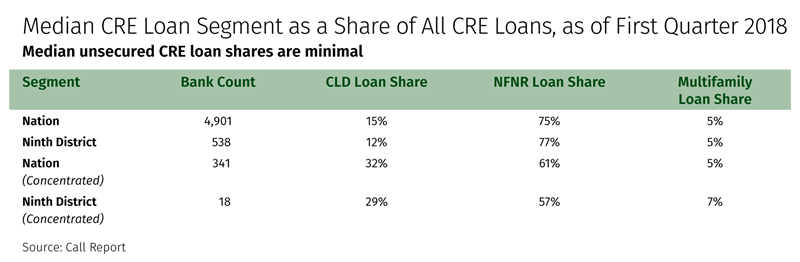
As mentioned earlier, the CRE loan portfolio includes several loan types, which are secured by real estate or are unsecured. The three secured loan types are CLD, nonfarm nonresidential (NFNR)—which includes office buildings, hospitals, and hotels, among others—and multifamily. Unsecured loans include loans for any CRE activity. Ninth District CRE shares for all banks and concentrated banks closely resemble those for banks across the nation. In the current quarter, NFNR loans are the largest share, followed by CLD and multifamily loans. These shares have been fairly constant over time, although CLD loan shares did rise and fall as banks moved into and out of the financial crisis period. The median multifamily share is relatively small in comparison with NFNR and CLD; however, it has more than doubled since the third quarter of 2012.
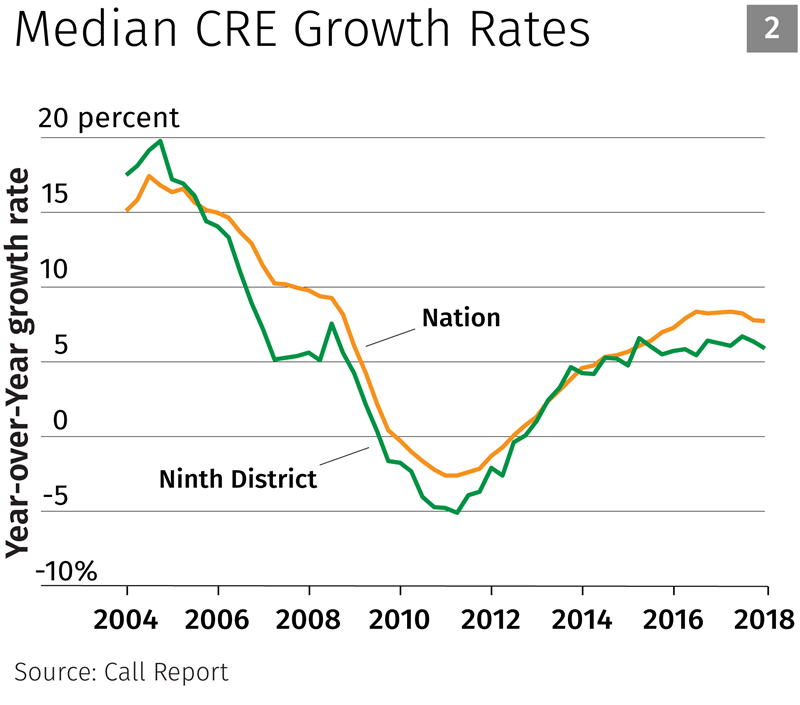
Median year-over-year growth rates for CRE loans in the Ninth District remain flat, holding at 5.6 percent. This level was first reached in the third quarter of 2015; nationally, CRE growth flattened a year later. The CLD share is a key factor in the portfolio‘s flat growth. At the same time that median national CRE growth flattened, median national CLD growth was declining. In the District, this relationship is less strong; median CLD growth flattened in concert with median CRE growth. The current rate of CRE growth in the District is the same as it was in 2007, during the run-up to the financial crisis.
CRE delinquencies
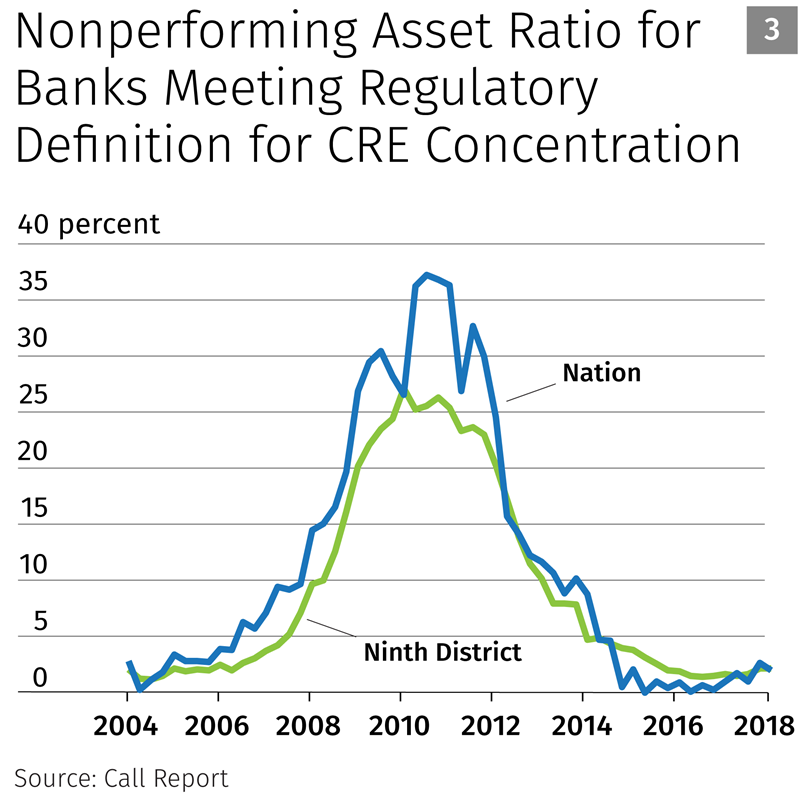
Recent media stories noted that rising delinquencies are responsible for the national slowdown in CRE growth; that is, the quality of the portfolio is declining. While current Call Report data corroborate that 30-89 day past-due delinquencies grew sharply since the fourth quarter of 2017, it is too soon to assess how delinquencies might impact CRE growth moving forward. To get a better sense of the portfolio’s overall health, it is useful to consider all delinquency types: 30-89 days past due, 90 days or more past due, and nonaccrual loans. One measure that examiners use for diagnosing a portfolio’s health is the nonperforming asset ratio, defined as total delinquencies to total equity plus the allowance for loan and lease losses (ALLL). It is evident from the time series of the median nonperforming asset ratio that portfolio health is strong relative to levels experienced in the financial crisis.
Conclusion
The CRE portfolio in the Ninth District appears sound in the current quarter. Banks in the District are well capitalized relative to total CRE delinquency levels. Although growth is near precrisis levels, other key risk factors that measure concentration and quality are acceptable and remain historically low.