Authors


Richard Liu
Research Associate, Institute
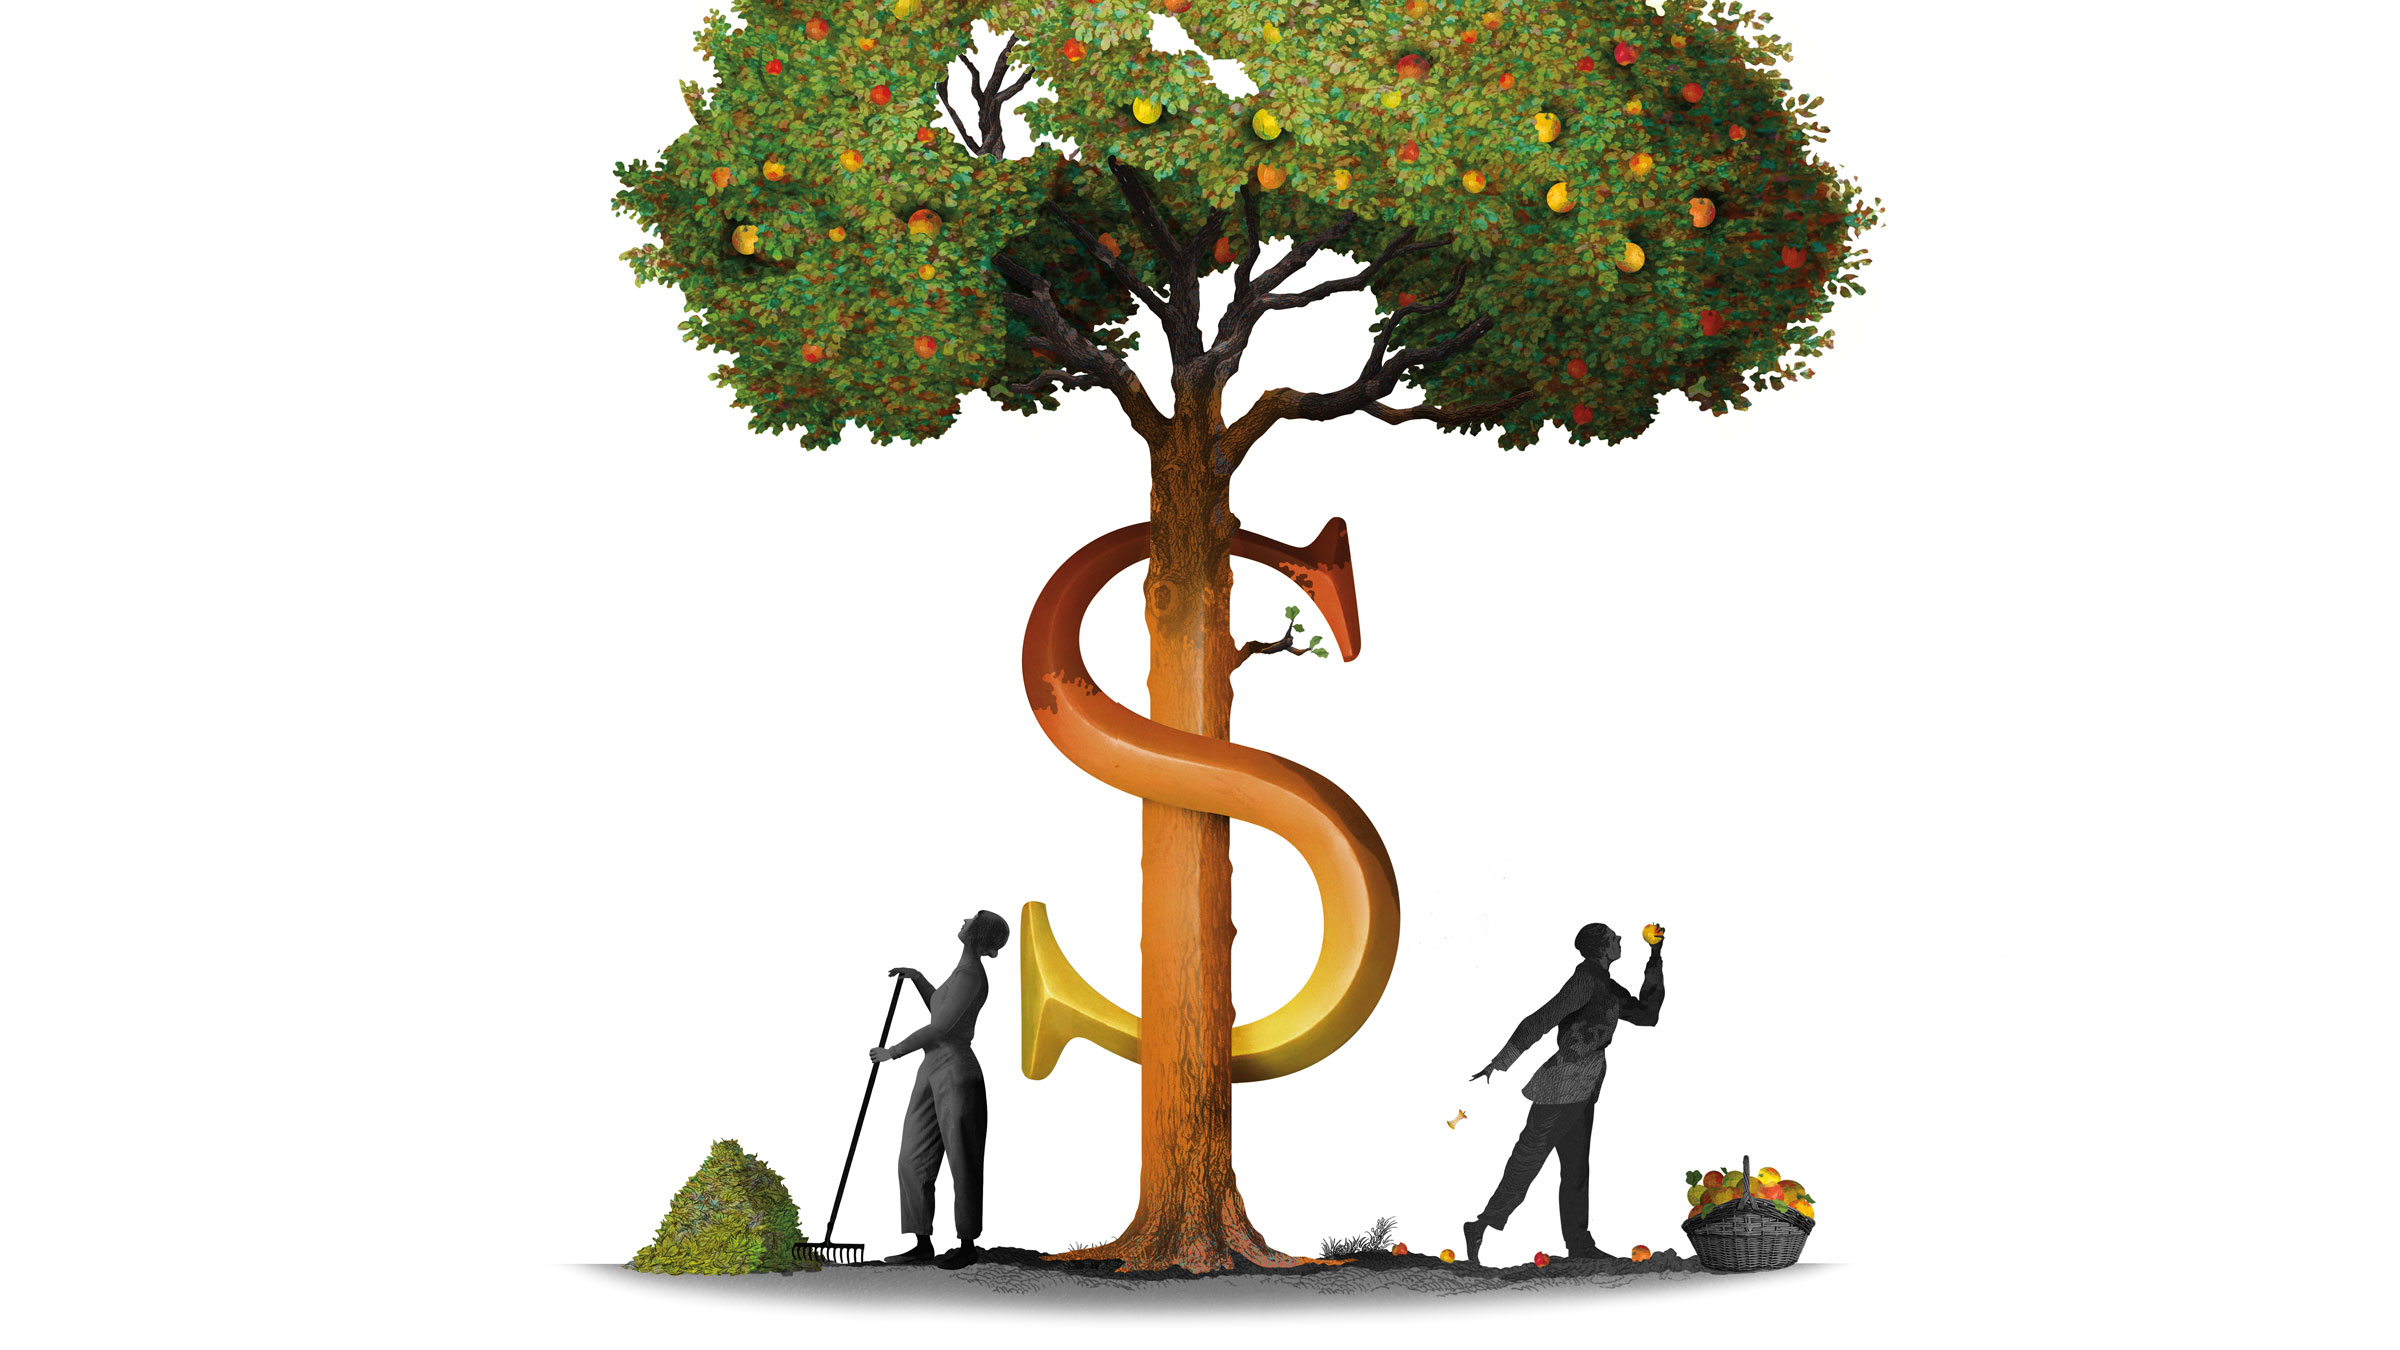
In 2025, personal income in the United States totaled around $26 trillion, according to the Bureau of Economic Analysis. Strikingly, only about 60 percent of that income came from wages, salaries, and benefits workers receive from employers. The other 40 percent came from the myriad sources that make up nonwage income.
At $11 trillion, nonwage income likely contributes importantly to household finances and the overall economy. But wage and salary income tends to be the star of the show when it comes to assessing Americans’ economic well-being. Nonwage income, a more eclectic category, receives less discussion.
This lower profile may stem from the fact that nonwage income is harder to measure and classify than wage income, especially in the case of gig workers, contractors, or self-employed individuals. Salary tends to be top-of-mind for survey respondents and is often neatly recorded on W-2 forms and paystubs. In contrast, nonwage income values may be less salient and less easily calculated due to the variety of sources that contribute to it.
Despite these challenges, this is an opportune time to examine the basics of nonwage income in the U.S. economy. As the population ages, increasing numbers of Americans are shifting toward nonwage income, including Social Security, retirement account withdrawals, and pensions, to cover purchases and expenses. What’s more, recent stock market growth means that equity gains have powered an expansion in this component of nonwage income. Nonwage income sources could contribute to ongoing strength in U.S. consumption even as the labor market has cooled and pandemic-era savings have been depleted.
In this article, we survey key facts about nonwage income in the U.S. We show how nonwage income is distributed in the population, which groups have relatively large shares of nonwage income, and what factors shape nonwage income for two groups that uniquely rely on it: higher-income Americans and older Americans.
Who has nonwage income?
As a starting point, Figure 1 shows the distribution of nonwage income and the distribution of wage and salary income among U.S. tax filers. These data come from the Opportunity & Inclusive Growth Institute’s Income Distributions and Dynamics in America (IDDA) resource. In 2023, the median value of nonwage income was about $3,000. This value reflects total household nonwage income divided by the number of adults in the household. So half of adults had a per-capita nonwage income that was less than or equal to this amount.
| Percentile of nonwage distribution | Nonwage income value | Percentile of wage and salary distribution | Wage and salary income value | |
|---|---|---|---|---|
| 10th | -$346 | 10th | $0 | |
| 25th | $0 | 25th | $13,800 | |
| 50th (median) | $2,972 | 50th (median) | $37,550 | |
| 75th | $20,930 | 75th | $64,430 | |
| 90th | $58,090 | 90th | $102,200 | |
| 95th | $92,560 | 95th | $139,900 | |
| 98th | $168,000 | 98th | $211,200 | |
| 99th | $274,600 | 99th | $289,100 | |
| 99.9th | $1,646,000 | 99.9th | $856,200 | |
| 99.99th | $8,976,000 | 99.99th | $3,317,000 | |
| 99.999th | $45,910,000 | 99.999th | $12,770,000 |
For most Americans, then, the amount of nonwage income they receive is small. In contrast, the median value of the wage and salary distribution was $37,550, about 12 times higher than the median value of nonwage income. Comparing the two distributions shows wage and salary income is a more important resource than nonwage income for most households.
The low value of median nonwage income suggests that self-employment and business income, two types of nonwage income, may not be as prevalent as headlines about the “gig economy” might lead one to expect. Indeed, the IRS’s Statistics of Income provide evidence that a significant majority of individual tax returns in 2022—around 80 percent—reported no business or self-employment income.
So which households do have nonwage income? There are two key groups.
First, nonwage income is concentrated at the top of the distribution. Figure 1 shows a large increase in the values of nonwage income at the highest percentiles of the distribution, reaching almost $46 million at the 99.999th percentile, or the top 0.001 percent by nonwage income.
Another way to see this concentration is to compare the top percentiles with the median in the two distributions. The top 1 percent of nonwage income earners bring in more than 90 times the median nonwage income. For wage and salary income, the same ratio is eight times. This indicates that nonwage income in the economy is more concentrated among a high-income group of households than wage and salary income.
A second group that has substantial nonwage income is older households. Figure 2 shows that while median nonwage income for all households was around $3,000, for households with individuals ages 65 and older it was $28,340. Indeed, at low, middle, and high percentiles of the distribution, older households have higher levels of nonwage income than all households.
Nonwage income at the top: Sources, shares, and relationship to wage and salary income
Figure 1 presents the distributions of nonwage incomes and wage incomes separately. In practice, households receive varying amounts of both income types. Using a joint distribution of wage and nonwage income, we can examine their relationship. Are top-income households more or less dependent on wage and salary income? And, what income sources contribute the most to high nonwage incomes?
Overall, for the highest-earning households, a larger share of their total income comes from nonwage income. For other households, a larger share comes from wage and salary income. Nonwage income accounts for about 66 percent of total adjusted gross income of the top 1 percent (IRS Statistics of Income 2022). Across all households, this ratio is flipped—nonwage income is 35 percent.
The joint distribution of nonwage incomes and wage and salary incomes suggests a U-shaped relationship. Both bottom and top wage earners are more likely to have top nonwage incomes relative to households in the middle of the wage distribution. Figure 3 shows that around 20 percent of households in the bottom quartile of wage income are in the top decile of nonwage income. Among the highest wage income households, around 15 percent are also in the top decile of nonwage income. In contrast, only 6 percent of middle wage and salary income households are in the top decile of nonwage incomes. A similar U-shaped pattern holds for the relationship between wage income and the share with nonwage income between the 75th and 90th percentiles of the nonwage distribution.
That 45 percent of low wage earners have high nonwage income may at first seem surprising, but it makes sense in light of who typically has low wage income in the population of tax filers: older households who have retired from the labor force and business owners who claim profits instead of wages.
Examining the various sources of nonwage incomes offers another lens for understanding top nonwage incomes. Figure 4 shows the contribution of various sources to the nonwage income of all households and of the top 1 percent of households. Some clear differences emerge. Pensions and retirement account distributions account for 25 percent in the overall population, but less than 3 percent of the nonwage income of the top 1 percent. Instead, capital gains and S corporation income (called “pass through” income because it passes to the owner’s personal tax return) account for 75 percent of nonwage incomes at the top, compared with around 45 percent in the overall population.
The larger share of pass-through income in the nonwage income of the top 1 percent of households highlights classification issues surrounding nonwage income for business owners, due to accounting incentives to collect compensation as profit rather than as wages. In other words, nonwage income may be a form of labor income in an economic sense. Research on pass-through business income supports this idea: Unlike returns to traditional financial assets, passthrough business profits fall by 75 to 80 percent after their initial owners prematurely die or retire even when the business continues (Smith et al. 2019; Bhandari and McGrattan 2021).
Older households rely on nonwage income but labor income is increasingly important
Older households are a second group for which nonwage income is important, as shown in Figure 2. Not only do older households have higher levels of nonwage income, they also rely on nonwage income because they typically have little wage and salary income. That reliance makes it particularly meaningful to investigate patterns in nonwage income and labor force participation across older households.
As people age and exit the workforce, their wage and salary income often goes to zero. Figure 5 confirms that nonwage income becomes the majority component of total household income after age 65. In fact, median wage and salary income drops from $50,000 among households ages 55–64 to $0 among households ages 65 and above. This means at least half of households have no wage and salary income after this point.
Figure 5 also shows that nonwage income increases as household members reach retirement age and their labor market earnings fall. The median value is $3,300 for ages 45–54, triples for ages 55–64, then nearly quadruples for ages 65–74.
Reliance on nonwage income varies not only with household age but across the income distribution as well. Figure 6 shows the average share of total household income that comes from nonwage sources for households ages 65 or older. Households are binned by their total household income.
Figure 6 shows a pattern with respect to older households’ total income that is reversed from that of the overall population, in which the highest-income households had lower shares of wage and salary income. For older households in the bottom quartile of total household income, almost 100 percent of their income is nonwage. For older households in the top quartile, the share is around 70 percent. So, the share is high across the distribution, but for households at the top, around 30 percent of their total income comes from wages and salaries. This contrasts with patterns for the overall population, shown earlier, in which the highest-income households had lower shares of wage and salary income. This suggests that, among older households, those with the most non-wage income are also most able to continue working into later years. The share of household income coming from different sources may be relevant when thinking about households’ resilience or response in the face of different types of economic shocks.
That higher-income older households engage more in the labor market is supported by survey evidence. Even though the members of many older households are retired and rely on nonwage income, a meaningful number—especially among higher-income households—still actively participate in labor markets. The likelihood that older households earned any positive amount of wage and salary income increased between 2000 and 2022 (Figure 7). For the highest-income quartile of households, the share with positive wages grew from 42 percent in 2000 to 58 percent in 2022. Among the lowest-income quartile of households, the share receiving positive wages was much lower, just 4 percent in 2000. But the share more than doubled by 2022, a smaller but steeper increase than among top-income households.
The increase in the likelihood of earning wages by older households could be due to multiple factors. It may reflect affordability concerns, if the nonwage income growth they experienced fell short of the growing cost of households’ needs. For instance, analysis suggests that recent inflation experienced by older Americans was slightly higher than average inflation for all Americans (Horwich 2024). Another possibility is that people may be more able to work into older ages, due to improved health or the availability of less physically demanding work.
Differences in nonwage income later in life have origins in labor market outcomes earlier in life
The article “Nonwage income: What is it made of?” shows that nonwage income received by the top third of older households is about four times larger than the nonwage income received by the bottom third. What contributes to these differences in nonwage income when households reach retirement age? One possibility is that working-age differences partly drive retirement-age outcomes across households.
For example, the largest components of nonwage income after age 65 are Social Security payments and disbursements from pensions and individual retirement accounts. These sources of nonwage income are typically a function of the household’s own past labor earnings. Social Security benefits, for instance, are a mandated percentage of average inflation-adjusted monthly earnings.
As a result, nonwage income after retirement is correlated with wage and salary earnings prior to retirement. Figure 8 shows that households with higher wages preretirement also have higher nonwage incomes postretirement.
However, the relationship between wages before retirement and nonwage income after retirement looks different for different racial and ethnic groups. Figure 8 also shows that even when Black and Hispanic households earn similar wages to White households preretirement, they tend to receive less nonwage income postretirement. In the chart, this is shown by the fact that the dots representing Black and Hispanic households are below the dots representing White households on the y-axis.
Research shows that Black and Hispanic households accumulate retirement savings at a lower contribution rate than White households (Choukhmane et al. 2024). Because Black and Hispanic workers are more likely to be on the lower end of the wage and salary income distribution, precisely where racial income gaps are larger, overall gaps in nonwage incomes in older age are all the more magnified (Kondo et al. 2024).
This suggests there are factors during the working years of lower-income Black and Hispanic individuals that impede the growth of seeds that yield nonwage income later in life. (See “Saving for retirement in America” in the spring 2025 issue of For All for a discussion of some of these factors.)
The value of keeping nonwage income in view
Nonwage income makes up approximately 40 percent of total personal income in the economy. In this article, we have shown that it differs in important ways from wage and salary income, its more familiar counterpart.
Nonwage income is more unequally distributed than wages and salaries, partly reflecting more dispersed entrepreneurial and financial success at the top. Two groups, older Americans and high-income Americans, uniquely rely on nonwage sources for the majority of their overall income. Both groups secure more than 60 percent of their household earnings from nonwage sources, but the sources of that income differ. While business income drives nonwage income among rich households, working-age labor market experiences shape future nonwage incomes among older Americans. And while older, typically retired Americans derive the bulk of their income from nonwage sources, there is a clear upward trend in the share that also supply labor.
Both monetary and fiscal policies are likely to have uneven effects across different income sources, and thereby across different groups. Policymakers may want to know which groups are likely to experience these effects and the extent to which they have other resources they can rely on. Fed policymakers, for example, may be able to better forecast the effects of a rate cut or a rate increase on total household incomes and labor force participation, say among retirement-age Americans. Similarly, with a richer classification of income sources, fiscal policymakers will better understand who may or may not respond to changes in different kinds of policies.
This article is featured in the Spring 2026 issue of For All, the magazine of the Opportunity & Inclusive Growth Institute
Lisa Camner McKay is a senior writer with the Opportunity & Inclusive Growth Institute at the Minneapolis Fed. In this role, she creates content for diverse audiences in support of the Institute’s policy and research work.