Authors


Article Highlights
- Minneapolis rent growth slowed in 2020 across multiple data sources
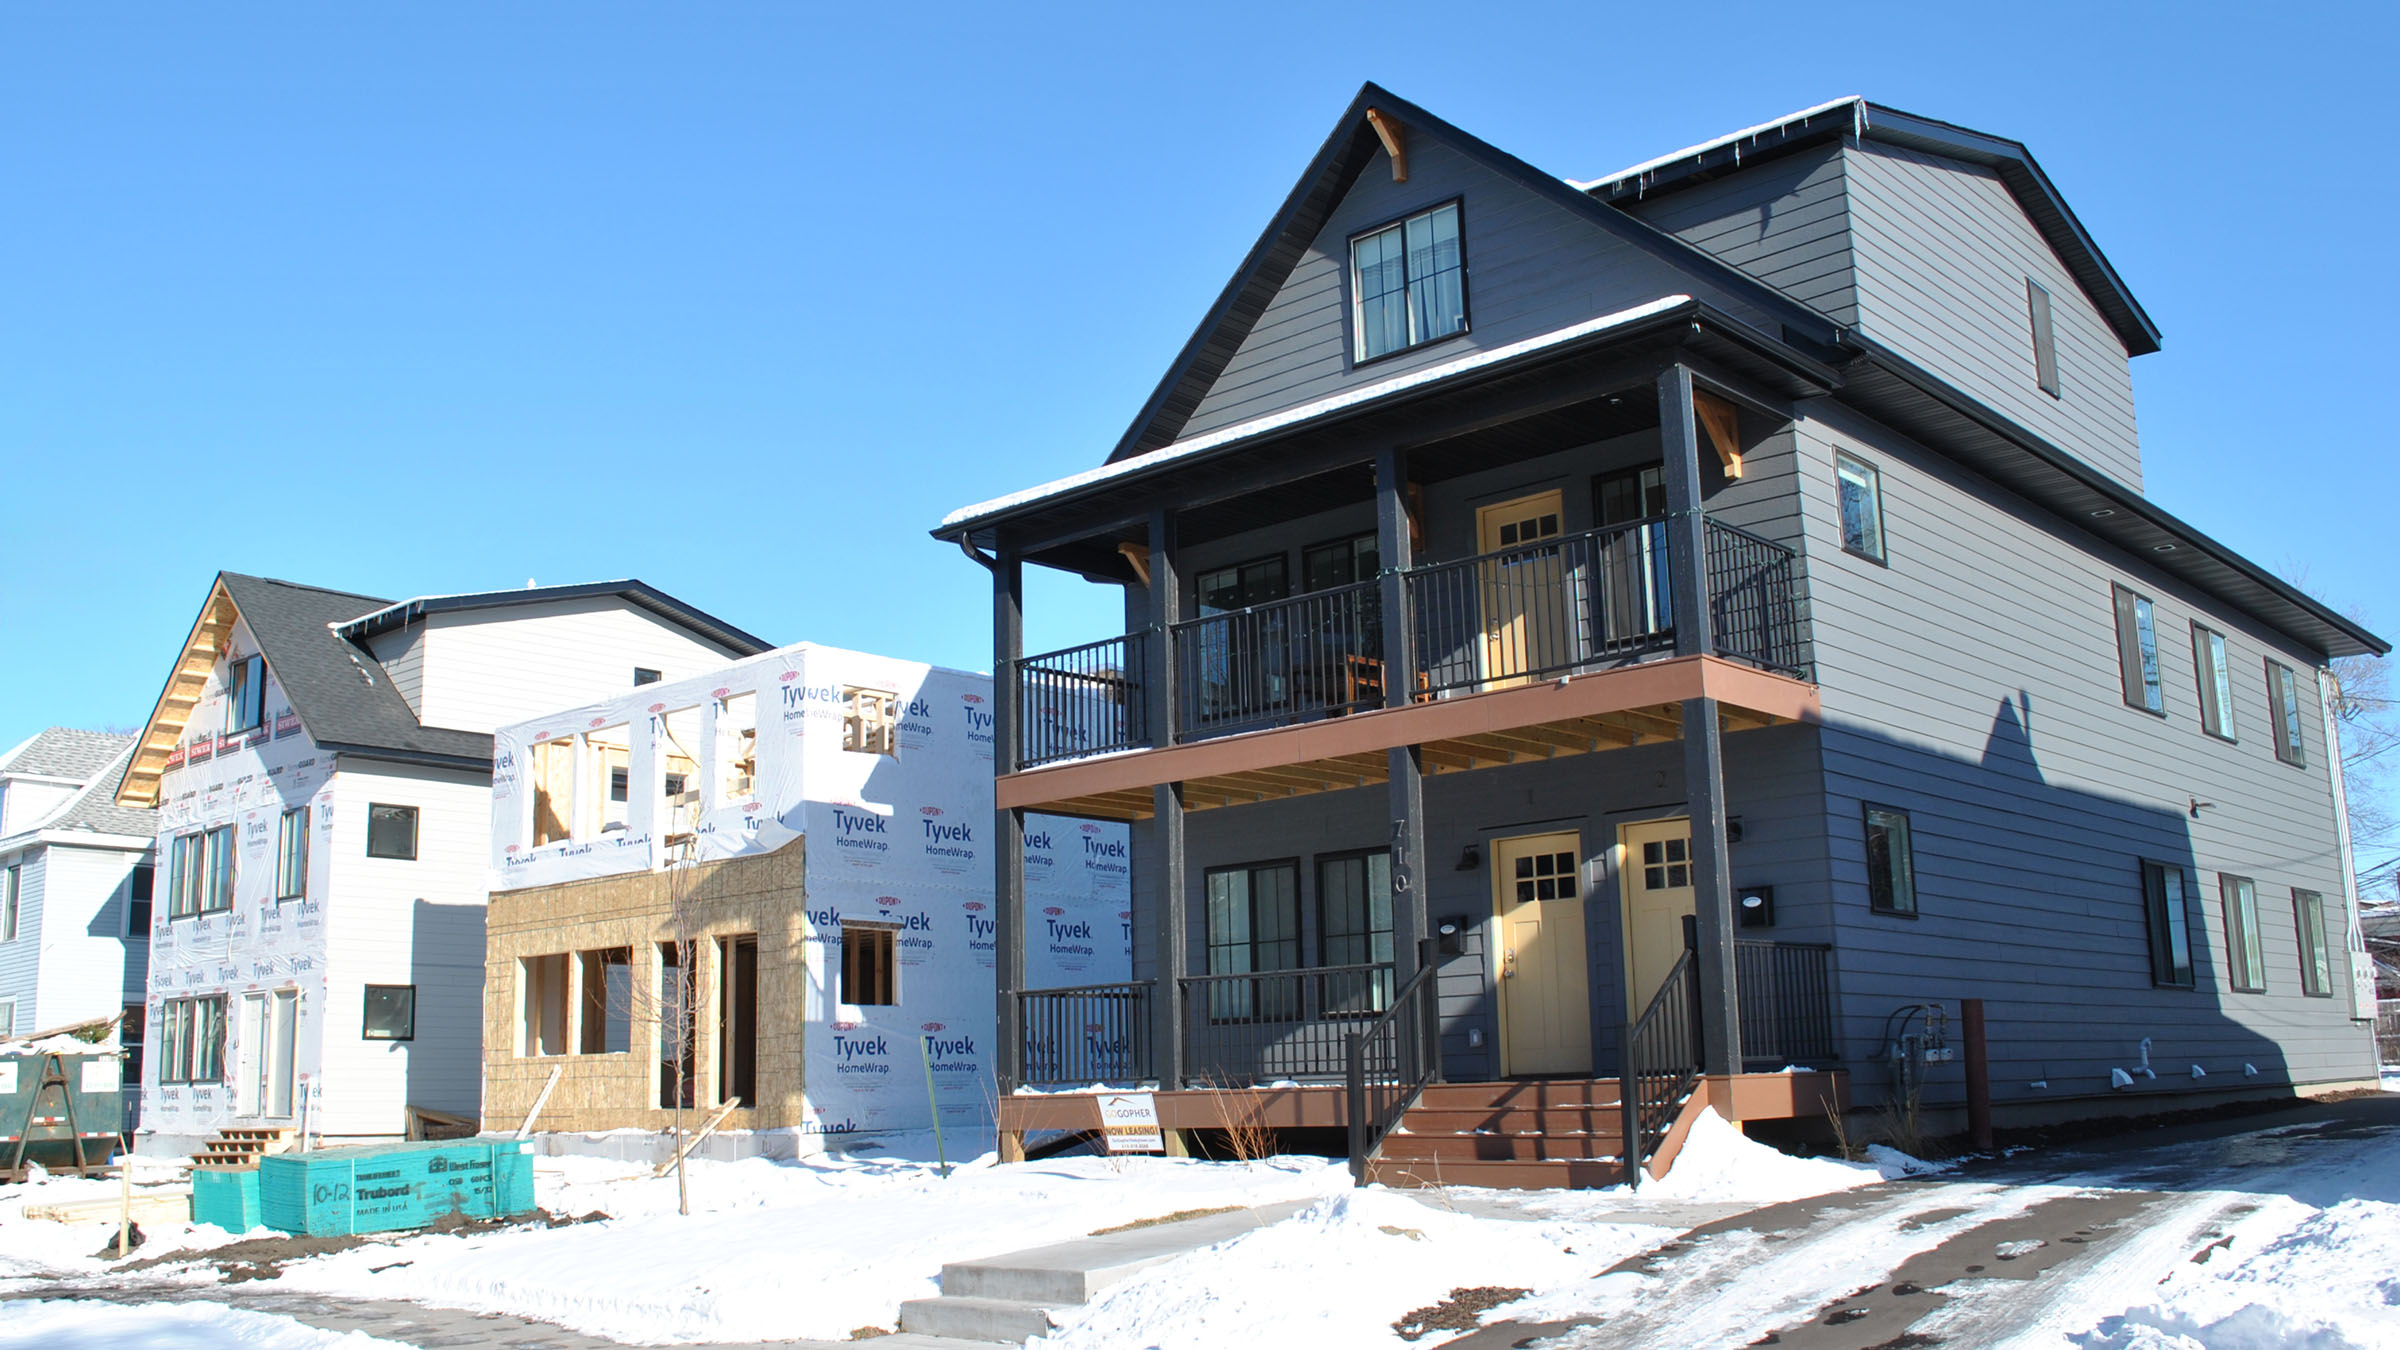
- Despite Minneapolis 2040 Plan, housing construction has lagged recently
- National comparisons suggest slowed rent growth is from demand weakness, not supply growth
In 2019, the City of Minneapolis made national headlines when it adopted the Minneapolis 2040 Plan. This comprehensive plan (hereafter called the 2040 Plan) contained a mix of policy changes intended to encourage more housing affordability in the city. In our latest analysis of data that track the plan’s progress, we find slowing rent growth in Minneapolis. On its face, relatively low recent rent growth in Minneapolis is consistent with anticipated effects of the 2040 Plan. However, our deeper dive into trends in rents and vacancies suggests that slow rent growth may result more from a negative housing demand shock specific to the Minneapolis market in 2020 than the expected impact of changes in the housing supply.
Our findings highlight the difficulty of disentangling effects of the 2040 Plan from other influences on the Minneapolis housing market that occurred at the same time. The findings do not imply that the 2040 Plan has or has not been successful to date. Rather, many of the policies codified in the 2040 Plan built on the City’s pre-2019 efforts to encourage housing production—efforts that our analysis focusing on the 2040 Plan itself does not capture. Additional years of data and deeper investigation will be needed to paint the full picture of the Minneapolis housing market and how it has responded to the 2040 Plan.
Our analysis is based on recent data updates to our Minneapolis Housing Indicators dashboard, which we created in 2020–2021 to report on changes in housing supply and affordability in Minneapolis post-2040 Plan adoption. The dashboard focuses on 11 core indicators and tracks 29 more. It compares Minneapolis to indicator-specific synthetic control groups that are based on trends in 126 similar cities around the nation. Within the respective control groups, the cities are weighted to match Minneapolis trends through 2019.1 Under standard statistical assumptions, these weighted comparison cities provide “counterfactuals”: hypothetical scenarios showing what would have happened in Minneapolis but for the adoption of the 2040 Plan. This approach helps disentangle the impact of the 2040 Plan from external events and trends that affected Minneapolis and comparison cities alike. (For additional detail on how we calculated indicators and structured the respective synthetic control groups, see our article “Minneapolis 2040 Plan data tool prepared to measure impacts” and the dashboard’s Technical Appendix.)
Rent increases in Minneapolis are slowing
Our dashboard analysis compares Minneapolis’ rents with rents in our comparison cities, using median rent from the U.S. Census Bureau’s American Community Survey (ACS). By 2023, the median rent in Minneapolis was $1,343, up 25.7 percent since 2019. Over these four years, Minneapolis’ median rent rose 3.2 percentage points less than the median rent for the comparison group. If Minneapolis’ median rent had increased at the same rate as the comparison group’s over that time, 2023’s median rent would be slightly higher, at $1,377. Putting Minneapolis into a national context, among the 126 cities we considered for our comparisons, only San Francisco area cities had lower rent growth than Minneapolis from January 2019 through December 2023. In January 2019, Minneapolis had the twenty-ninth-highest rent among the 126 cities we considered for our comparisons; in December 2023, Minneapolis had the seventy-fourth-highest rent, the largest decline in rank for a city during this time.
The rental and real estate listing websites Apartment List, CoStar, and Zillow shed additional light on changes in rents in both Minneapolis and our comparison cities. These private data sources differ from the ACS and one another in how they measure changes in rental prices, how frequently they produce estimates, and which housing units they include. While the ACS reflects the experiences of longer-term renters, these private data sources rely heavily on recent rental listings, which may provide a more accurate portrayal of current rental market conditions.
In the three private datasets, rents in Minneapolis and the comparison cities grew similarly from 2017 through 2019. During summer 2020, however, Apartment List, CoStar, and Zillow data all show that rent growth in Minneapolis began to lag rent growth in our comparison cities. As shown in Figure 1, when we compare the first 2019 observation with the last 2023 observation in each dataset, we find that Apartment List showed Minneapolis rents falling 3.5 percent, while they increased 22.4 percent in the comparison cities; CoStar showed Minneapolis rents growing 3.2 percent, compared to an increase of 17.5 percent in the comparison cities; and Zillow showed Minneapolis rents growing 10.0 percent, while they increased 32.2 percent in the comparison cities. These monthly and quarterly data show a clear break between rents in Minneapolis and the comparison cities beginning in summer 2020 and persisting since then.
Multiple data sources show slower rent growth in Minneapolis since summer 2020 than in the comparison cities
Source: Authors’ calculations using data from the American Community Survey 1-Year Estimates, Zillow, Apartment List, and CoStar.
After permitting peaked through 2022, new multifamily construction dropped dramatically
What’s driving the variation between the housing market in Minneapolis and the housing markets in the comparison cities?
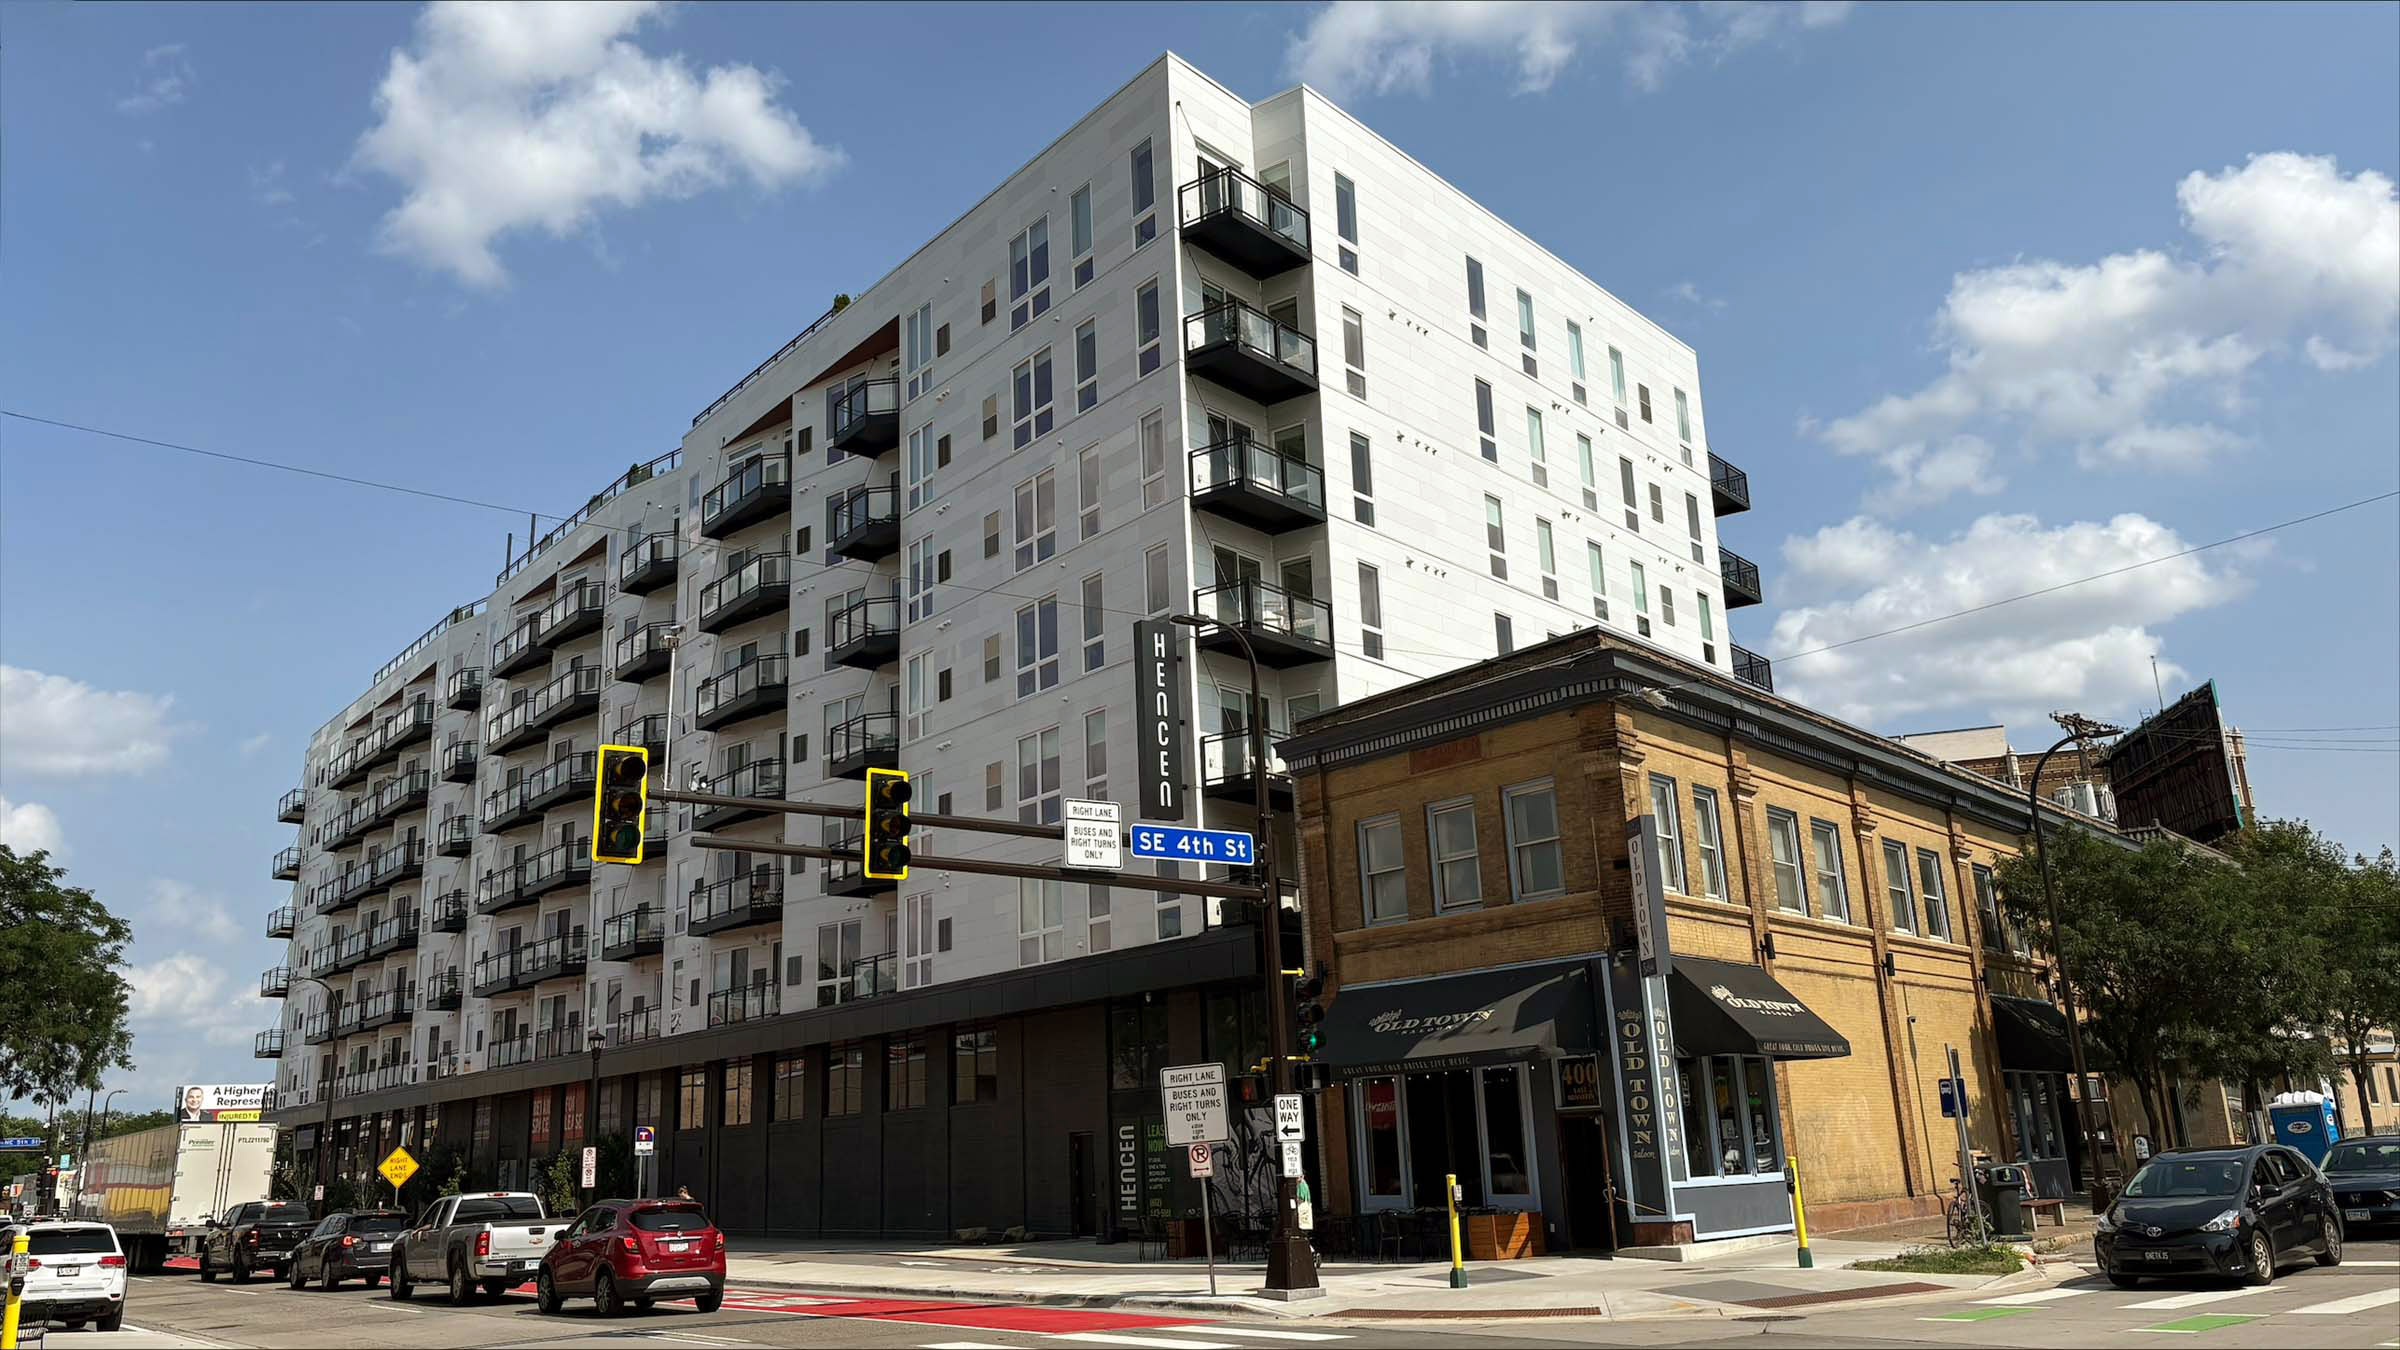
Many recent commentaries on rent trends in Minneapolis have pointed to the city’s increased housing supply as a driver of slow rent growth. And certainly, Minneapolis permitted more multifamily housing in the five-year period ending in 2022 than in any five-year period in recent history, adding over 18,000 new units in multifamily buildings (those with five or more units). While the number of new multifamily units permitted peaked in 2019 at 4,646, the years 2018, 2020, 2021, and 2022 were also among the top for permitting.2 Over this five-year period that includes both before and after the adoption of the 2040 Plan, Minneapolis produced incrementally more (a 2 percent increase) than the multifamily permitting comparison group. (See our dashboard.)
In 2023 and 2024, high interest rates, increasing operating costs, high construction costs, and low rent growth challenged the profitability of multifamily apartments and slowed multifamily construction in many markets, both locally and nationally. Permitting in Minneapolis dropped to 1,043 units in multifamily buildings in 2023, 77.6 percent below 2019’s peak, and 351 units in multifamily buildings in 2024, 92.4 percent below the 2019 total. In contrast, in 2023 permitting in the comparison group fell 60.2 percent from the 2019 peak and in 2024 it was down 65.7 percent from the 2019 peak, suggesting that multifamily construction fell more in Minneapolis than elsewhere.
Looking instead at new apartments available for occupancy, Minneapolis peaked at nearly 5,000 over the 12 months ending in October 2020. Figure 2 compares new apartments available for occupancy in Minneapolis with the comparison groups for both multifamily permitting and median rents from the dashboard. Both comparison groups have seen increases in numbers of new apartments available for occupancy since 2020, while Minneapolis saw a drop-off to just over 2,000 new apartments in the 12 months ending July 31, 2023. New apartments available for occupancy peaked again at nearly 5,000 in the 12 months ending July 31, 2024, and have fallen off since. Using new apartments available as an indicator for occupancy, we see that multifamily rental construction has fallen more in Minneapolis than in either comparison group.
In addition to new multifamily construction, much of the attention to the 2040 Plan focused on its “legalization” of duplexes and triplexes on all residential lots. Our dashboard tracks new duplexes, triplexes, and fourplexes permitted in Minneapolis and identifies new structures built on land that had before 2020 allowed only single-family homes.3 Over 2020 to 2024, Minneapolis permitted 87 new duplex, triplex, and fourplex buildings, creating 225 new housing units. While these units would not exist were it not for the 2040 Plan, they represent a fraction of new housing compared to the 11,503 units in multifamily apartment buildings constructed in the city over the same period. Permitting of duplexes, triplexes, and fourplexes peaked in 2023 with 24 new duplex, triplex, and fourplex buildings containing a total of 63 new units. Of these 24 buildings, 11 were in areas that previously allowed only single-family homes.
What about demand?
While rents in our comparison cities began to rise quickly in mid-2020, Minneapolis rents remained steady. Other cities that had similar multifamily production trends as Minneapolis (shown in teal in the figures) still saw climbing rent trajectories. If housing production were responsible for the slow growth in rents in Minneapolis, these other cities likely would have seen similar trends. Instead, rent growth in Minneapolis lagged.
Rental vacancy rates are another indicator of housing market conditions. As rent growth in Minneapolis slowed in summer 2020, rental vacancies increased in Minneapolis beyond the increases in our comparison cities.4 As shown in Figure 3, Minneapolis’ rental vacancy rate peaked at 9.5 percent in October 2020, 0.7 percentage points below the vacancy rate in cities that had similar multifamily production and 2.6 percentage points above the rate in cities that had similar rent trends in 2019 and before. Most of the increase in vacancies occurred in newer buildings.
Minneapolis’ vacancy rate peaked in 2020
Source: Authors’ calculations using data from CoStar.
Minneapolis’ slower rent growth and higher vacancy rates, combined with its similar-to-lower number of new units coming online than in the comparison cities, suggest a negative housing demand shock occurred in the city in 2020. In other words, despite increases in the housing supply, data indicate that fewer renters wanted to move to, or remain in, Minneapolis during this time period. Older buildings (those built in 2017 and earlier) saw a significant jump in vacancy rates through summer 2020 unlike in either our rent comparison cities or our multifamily permitting comparison cities. By October 2020, the vacancy rate in buildings built prior to 2018 had jumped more than 2 percentage points to 6.6 percent. Further demonstrating the weakness in the Minneapolis market back in the first quarter of 2021, 3.6 percent of new apartment leases included rent concessions, compared to 1.3 percent in our rent comparison cities and 2.2 percent in our multifamily permitting comparison cities.
If lower rents were the result of the increased supply, other cities that saw similar increases in multifamily supply would also be seeing weak rent growth. If the COVID-19 pandemic and the effects of remote workers relocating farther from their place of employment were behind sluggish rent growth, both Minneapolis and our comparison cities would see the impacts. But Minneapolis stands alone. The timing of this shock aligns with narratives we have heard about the Minneapolis and St. Paul markets during conversations with local housing providers.
As we consider the recent data, it appears that effects of the negative demand shock for rental housing in Minneapolis have stabilized. While Minneapolis has lower rents than the comparison cities, the magnitude of the gap between Minneapolis and elsewhere is now stable, and Minneapolis is experiencing similar patterns of rent growth, albeit at lower levels. According to CoStar, the Minneapolis vacancy rate stood at 6.7 percent as of January 2025, tied for its lowest level since January 2020.
Minneapolis adopted the 2040 Plan expecting that easing housing regulation would reduce the cost of developing new housing, thereby increasing the supply, and that additional housing would reduce the cost of housing for city residents. Investments in new construction benefit renters by creating more options, whether in the form of new units themselves or in vacancies created when other renters move into new units. Since the adoption of the plan, rents as measured by multiple data sources have grown more slowly than in our comparison groups, as a function of both increased supply and decreased demand. With minimal rent growth alongside increases in the costs of construction, borrowing, and operations, new development has slowed in Minneapolis more than in our comparison groups. If and when demand strengthens, we anticipate that Minneapolis will become more appealing to developers.
What lies ahead?
When Minneapolis adopted its 2040 Plan in late 2019, the city was in the vanguard of local governments changing their land use policies to promote greater housing supply and affordability. Since then, other cities and entire states have adopted similar policies with similar goals. When we created our synthetic control model, we removed the few cities subject to land use policies similar to the 2040 Plan. Our research suggests that today, at least one-third of our 126 comparison cities have more permissive land use policies than they did in 2020.
This change in the landscape makes it more difficult for us to find clear effects of the 2040 Plan. As our comparison groups now have a mix of cities that did and did not enact more permissive land use policies in recent years, the comparisons will show a less demonstrable impact of the plan. Furthermore, the Minneapolis-specific negative housing demand shock that seems to have occurred at the same time as the plan’s implementation additionally complicates any evidence of the impact of the plan to date.
The Federal Reserve Bank of Minneapolis will maintain and update its Minneapolis Housing Indicators dashboard throughout the lifetime of the 2040 Plan—that is, until Minneapolis adopts its 2050 Plan toward the end of this decade. As we update the dashboard, we’ll continue to analyze the effects of the 2040 Plan. This work informs housing policy that seeks to advance the economic well-being of low- and moderate-income households. And it aligns with the Minneapolis Fed’s mission to pursue an economy that works for all of us.
Our dashboard update in early 2026 will be the first to include five-year data from the ACS entirely collected since the adoption of the 2040 Plan in 2019. With that update, all or almost all indicators will have timely data that will allow us to more concretely assess the impact of the 2040 Plan on housing affordability in Minneapolis. We’re excited to see what these new data can teach us.
Endnotes
1 In identifying cities whose historical trends are a match, the Federal Reserve Bank of Minneapolis drew on 126 cities that are roughly similar to Minneapolis in size (population 150,000–2,000,000); had no similar land use policy as of 2019; would see no geographic spillover effects from Minneapolis; and, like Minneapolis, are principal cities in their metropolitan areas. Learn more in the dashboard’s Technical Appendix.
2 The absolute numbers of new units permitted vary across the two primary sources of data for residential building permits in the Minneapolis-St. Paul area, the U.S. Census Bureau and the Metropolitan Council. The Metropolitan Council, a regional planning and policymaking body for the Minneapolis-St. Paul area, generally reports higher numbers of building permits than the U.S. Census Bureau does. While the specifics vary, the overall trends of high production during this time period are consistent. For the multifamily housing permit numbers in this article, which are consistent with our Minneapolis Housing Indicators dashboard, we use U.S. Census Bureau data to allow national comparisons.
3 Our data from the Metropolitan Council combine duplexes, triplexes, and fourplexes into one number and do not include conversions of previously single-family homes to duplexes or triplexes. As the 2040 Plan only legalized duplexes and triplexes, we assume that any newly constructed fourplex is built on land that previously allowed a fourplex and therefore was not a result of the 2040 Plan.
4 In our Minneapolis Housing Indicators dashboard, we weight the comparison cities differently for each indicator in order to most closely match Minneapolis trends through 2019. Because vacancy rates interact with both housing production and rent levels, for the vacancy rate indicator we present comparative data using both weightings of comparison cities.
Libby Starling is Senior Community Development Advisor in Community Development and Engagement at the Federal Reserve Bank of Minneapolis. She focuses on deepening the Bank’s understanding of housing affordability, concentrating on effective housing policies and practices that make a difference for low- and moderate-income families in the Ninth Federal Reserve District.
Maxine Xu is a data scientist in the Minneapolis Fed’s Community Development and Engagement division, where she develops data tools and leads analyses to explore issues affecting the economic well-being of low- to moderate-income communities.