Authors


Article Highlights
- Following four solid years, Twin Cities region failed to meet goal for housing production
- Region did meet goals for new affordable housing and Black homeownership
- Housing in Twin Cities region remains affordable relative to that of similar metropolitan areas
In 2023, the Twin Cities region failed to meet an overall housing-supply goal and barely met a goal for creating affordable housing but saw continued progress on a goal to increase Black homeownership. The mixed results follow two consecutive years of meeting all three housing goals for the seven-county Twin Cities region1 that were established in the Regional Housing Affordability Dashboard. As set out in this interactive data tool created by the Itasca Project and the Federal Reserve Bank of Minneapolis, the Twin Cities region will: first, supply 18,000 new housing units per year; second, meet the Metropolitan Council’s goal of creating 2,090 new affordable housing units per year; and third, stay on track to match the national Black homeownership rate by 2030.
According to a dashboard update consisting of data from 2023, in that year the region fell more than 2,500 units short of meeting the first goal while just surpassing the second goal by less than 100 units. However, the Black homeownership rate edged upward from 32.8 percent to 34.3 percent. Below, we look into what was happening in 2023 to drive these results, and what regional housing leaders expect in the future.
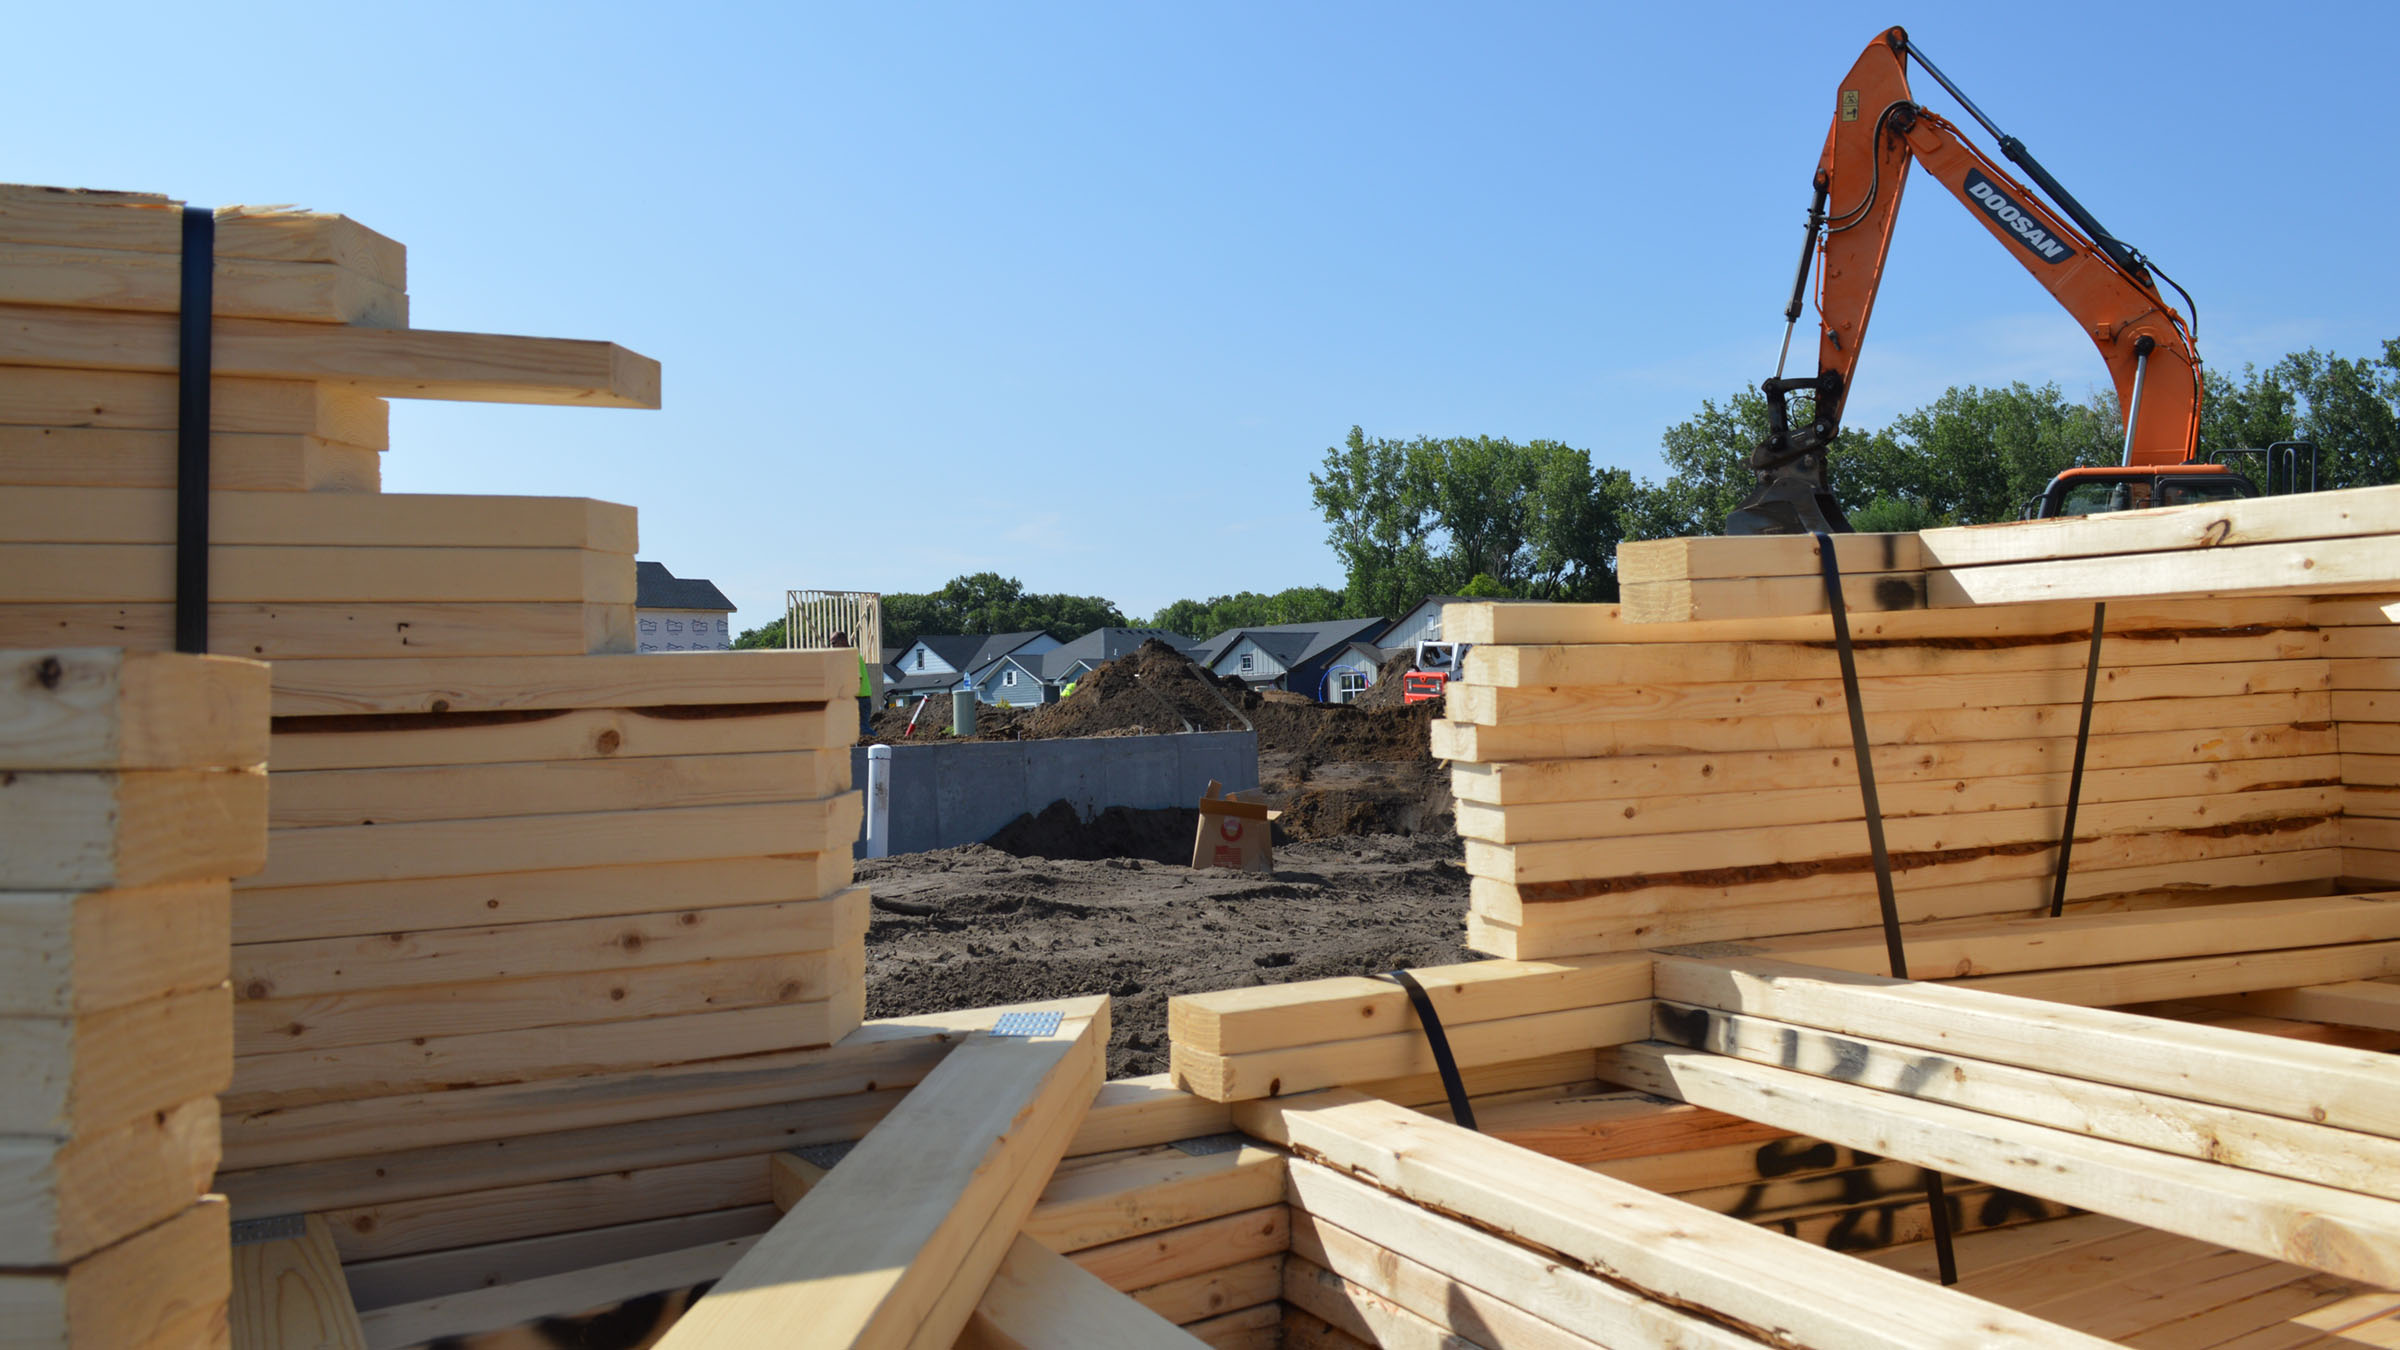
Goal 1: Supply 18,000 new housing units per year
Continued growth of the housing supply is necessary to accommodate population increases and address the need for long-term affordability across the regional housing market. The annual goal of 18,000 new housing units, which was set by the Itasca Project’s Housing Affordability Task Force, both creates opportunity for ongoing household growth and mitigates the supply deficit created during the Great Recession. Sustaining this level of housing construction over time would help slow the growth of housing costs in the region.
After four consecutive years of meeting the 18,000-unit goal, the Twin Cities region permitted only 15,473 new units in 2023, or 86 percent of the goal for housing production. According to Robb Bader, board president of the Twin Cities Housing Alliance, “The production shortfall reminds us that the Twin Cities region cannot afford complacency in meeting our housing needs.”
Rents in the metro area have been rising, albeit slowly, as many new rental units permitted in previous years are now opening for occupancy. According to the Zillow Observed Rent Index, rents rose by 3.2 percent from November 2023 to November 2024. Meanwhile, the 12-month rolling median sales price for owner-occupied homes calculated by the Minneapolis Area Realtors and Regional Multiple Listing Service of Minnesota reached $380,000 in November 2024, up 2.7 percent from November 2023.
The 18,000-unit goal is designed to benefit all households in the region as costs increase, noted Bader.
“We need to maintain our focus on producing 18,000 new units annually to ensure that everyone, across all income levels, can find a stable home,” he said. “By ensuring our region’s housing supply meets demand, we can keep rents stable, support economic growth, and provide security for our residents. It’s about sustaining our communities for the long term and making the Twin Cities a place where everyone can thrive.”
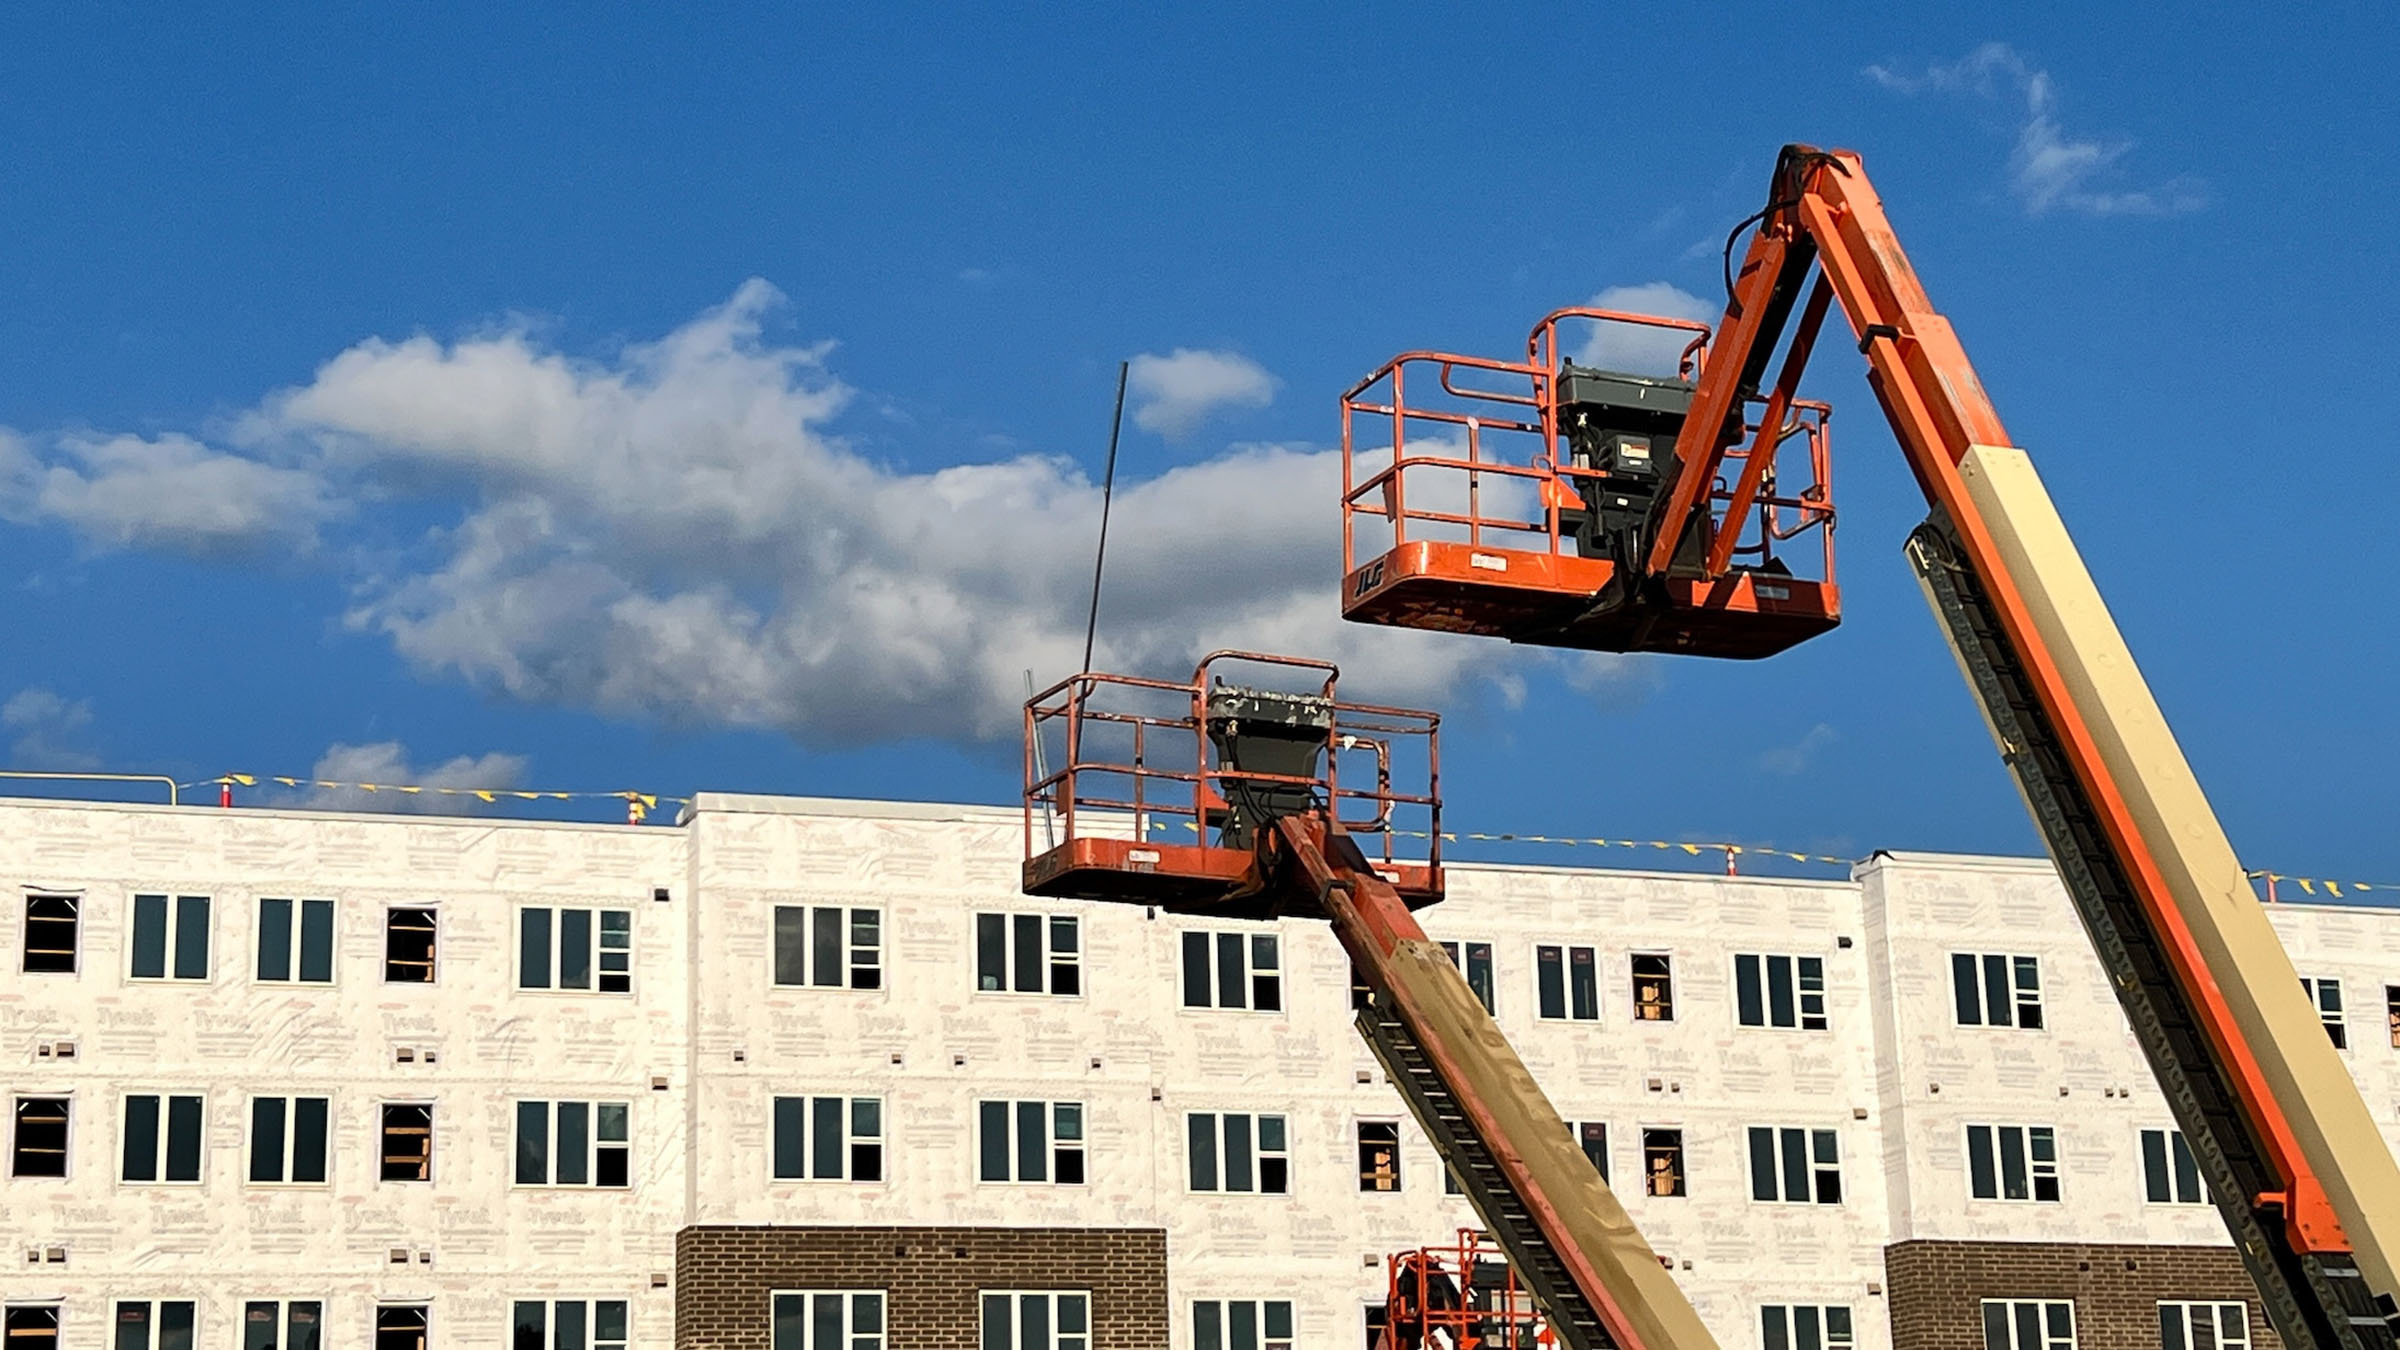
Goal 2: Meet existing affordable housing production commitments of 2,090 units per year
New housing at any price point ultimately creates new opportunities for more housing affordability across the income spectrum. At the same time, new affordable housing—that is, units that are affordable to households earning 60 percent of the area median income (AMI)—quickly creates new opportunities for housing stability for lower-income individuals and families. Over the decade from 2021 to 2030, goals set in collaboration between the Metropolitan Council—the regional policymaking body, planning agency, and essential-services provider—and local governments aim for an annual average of 2,090 new affordable units, both publicly subsidized and not, across the seven-county Twin Cities region.
After record-setting totals of new affordable housing in 2022, the region saw 2,239 new affordable housing units in 2023, barely above the annual goal of 2,090. Production in 2023 was just over half of 2022’s record high of 3,889 new affordable housing units.2 Metropolitan Council Chair Charlie Zelle described the 2023 numbers as “meaningful progress after recent years of increased development activity and new public investment in affordability,” and added, “We’ll continue to provide support and assistance for communities to build on it.”
Continued production of new affordable housing remains necessary to stay on track relative to the goals. Although in the last three years the region has produced 40 percent of the 2021–2030 goal of 20,900 total units, the need for new affordable housing remains far higher.
“Affordable housing isn’t being built at the same rate in every community, and market conditions could change dramatically over the course of the decade,” Zelle noted. “As many as 12 percent of the people who live in the metro area make less than $37,500 a year and are in need of deeply affordable housing.”
In its 2040 Housing Policy Plan from 2015, the Metropolitan Council estimated the Twin Cities region would need nearly 38,000 new affordable units in the 2021–2030 period just to meet expected population growth. More recently, the Metropolitan Council forecasted that the region will need nearly 40,000 new affordable units in the ensuing 2031–2040 decade to accommodate expected growth. Addressing the challenges of the nearly 250,000 low-income Twin Cities households already paying more than they can afford for their housing would require even more new affordable housing.
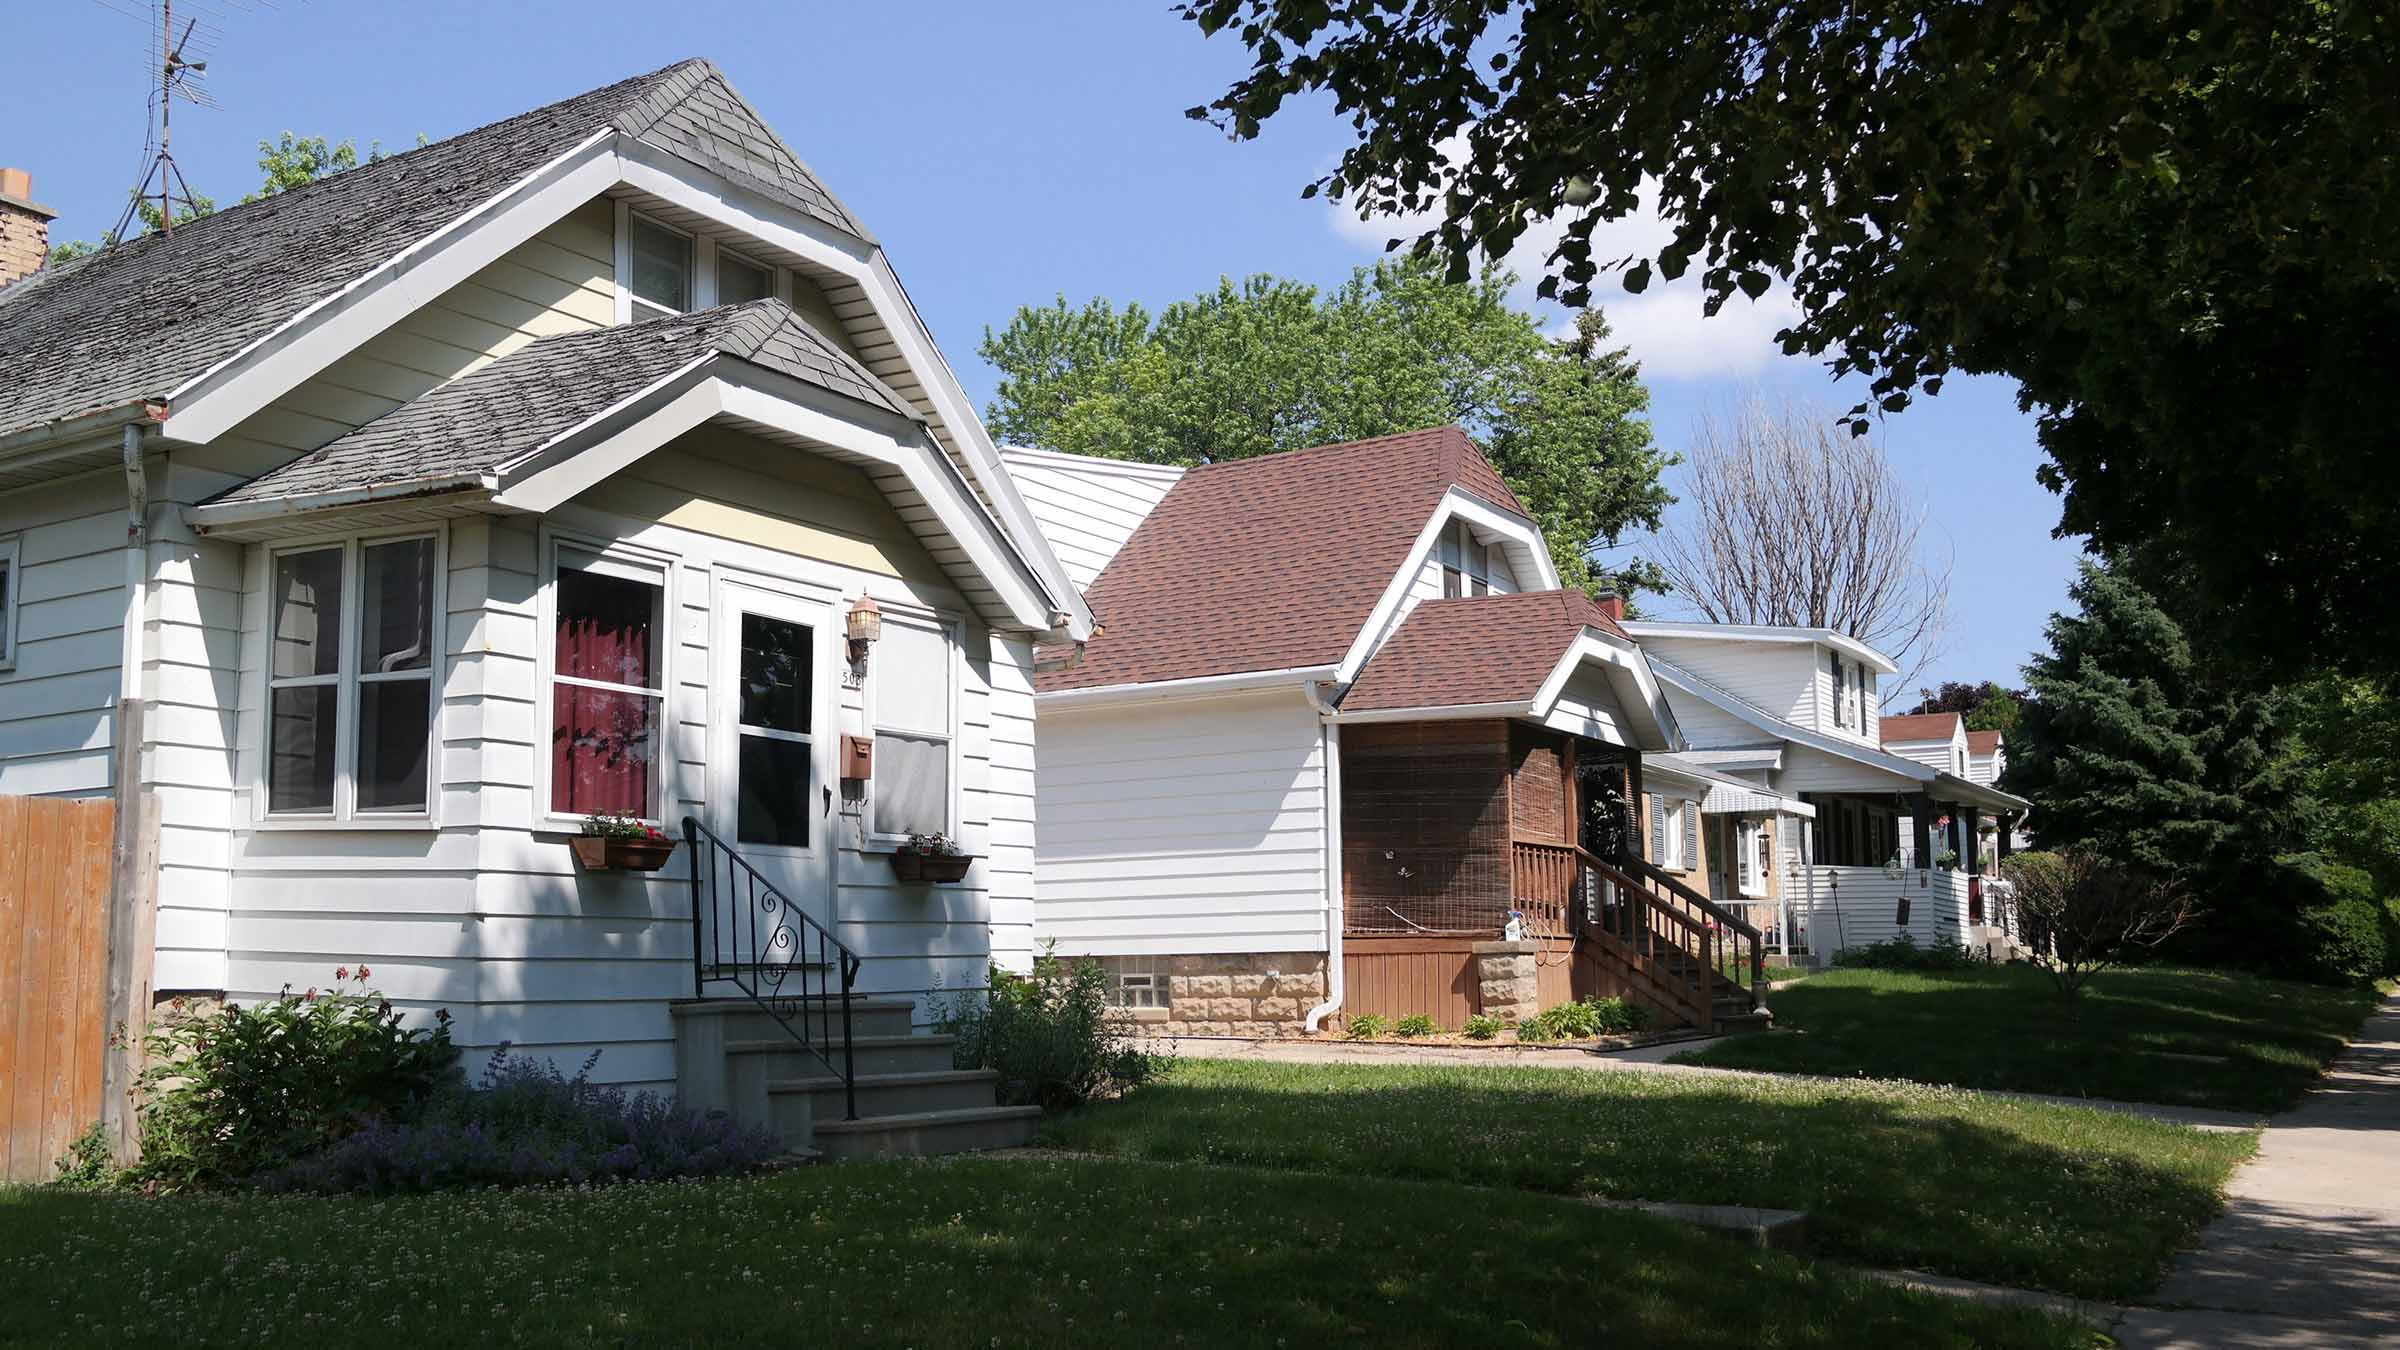
Goal 3: Match the national Black homeownership rate by 2030
The final goal measures the Twin Cities region’s progress toward matching the national Black homeownership rate of 45 percent by 2030. In both the region and across the nation, Black households have faced barriers to homeownership, such as a long history of racial discrimination and challenges in obtaining mortgages. In 2023, the Twin Cities region’s Black homeownership rate reached 34.3 percent, the highest homeownership rate for Black households in the region this century. Black homeownership edged upward 1.5 percentage points over 2022.
Reacting to this upward trend, Roxanne Young Kimball, president and CEO of the Minnesota Homeownership Center, observed, “Continuing to ramp up investments in culturally competent home buyer and credit counseling, focused down payment assistance, and affordable homeownership development are key to maintaining this trend and eliminating racial disparities in homeownership for good. The Twin Cities’ Black homeownership rate has been far below the national Black homeownership rate for too long, and now is the time for us to come together as a region to address it.” To fully meet the goal of 45 percent by 2030, the Black homeownership rate will need to continue to increase 1.5 percentage points annually for the next seven years.
How the Twin Cities compares to peer regions
The Regional Housing Affordability Dashboard not only measures the Twin Cities region’s progress against the Itasca Project’s goals but also compares the housing performance of the Minneapolis-St. Paul metropolitan statistical area (MSA) against that of 11 peer MSAs identified by GREATER MSP, a regional public-private economic development partnership. Compared to housing in our peer regions, housing in the Minneapolis-St. Paul MSA remains relatively affordable. However, despite recent progress, the region continues to lag its peers in reducing the disparity between Black and White homeownership rates.
Among the peer regions, only the Pittsburgh MSA is consistently more affordable than the Minneapolis-St. Paul MSA. Rents in the Minneapolis-St. Paul MSA, measured by the Zillow Observed Rent Index, are the second-lowest of the peer regions, and the region has the second-highest share of rental units affordable to households earning 50 percent of AMI. The share of cost-burdened households—that is, the share of households spending more than 30 percent of their income on housing costs—in the Minneapolis-St. Paul MSA decreased from 30.0 percent in 2022 to 28.4 percent in 2023, making it the second-lowest share of housing cost burden, above only that of the Pittsburgh MSA.
Despite missing its housing-production goal in 2023, the Minneapolis-St. Paul MSA remains in the middle of its peer group in residential housing units permitted per 1,000 residents. In 2023, cities in the MSA permitted 4.7 new housing units per 1,000 residents. For context, 4.7 is just under one-third of the Austin (Texas) MSA’s 15.4 new units per 1,000 residents, but well above Chicago’s 1.5 new units per 1,000 residents. While not dramatic, this growth in the housing supply in the Minneapolis-St. Paul MSA may have helped rent increases moderate. Based on Zillow estimates, rents in the Minneapolis-St. Paul MSA have increased at a rate lower than those of most of our peer regions. At 17.1 percent, the region’s five-year change in the typical market-rate rent was among the lowest, second only to that of the San Francisco MSA, which starts with the highest rent of the peer regions.
The overall homeownership rate in the Minneapolis-St. Paul MSA hit 70.0 percent in 2023, second only to the 70.3 percent of the Pittsburgh MSA. Among the peer regions, the Twin Cities MSA continues to have the largest gap between Black and White homeownership rates, at 41.5 percentage points. For comparison, the disparity in homeownership rates in the Minneapolis-St. Paul MSA was about 20 percentage points larger than those of Austin, Atlanta, and San Francisco—the three best-performing MSAs—which had disparities of 22.5 to 22.7 percentage points.
Continued progress requires concerted effort
After two years of success across all of its key housing goals, the Twin Cities region’s mixed results in 2023 reinforce the need for concerted effort over the long term. Relative to its peers, the Minneapolis-St. Paul MSA remains affordable. The tempering growth in rents seen in some data sources through 2023 may be the result of high housing production in the previous four years, as permitted units open up for occupancy. However, the drop in new housing construction that began in 2023 may push housing prices higher, placing further stress on housing affordability. Continued growth in housing supply in future years will help the Twin Cities region not only meet housing demand but also mitigate the housing affordability challenges that are stressing household budgets.
Explore the dashboard
The Regional Housing Affordability Dashboard provides data broken out by race and income, and displays indicators across both time and geography. The Minneapolis Fed refreshes the data in the dashboard at least annually.
Endnotes
1 The seven counties are Anoka, Carver, Dakota, Hennepin, Ramsey, Scott, and Washington.
2 As of January 2024 when our last Regional Housing Affordability Dashboard update article was published, the dashboard indicated there were nearly 3,800 affordable housing units created in the Twin Cities region in 2022. The dashboard’s total for 2022 has since increased to 3,889 as additional affordable housing units have been identified.
Libby Starling is Senior Community Development Advisor in Community Development and Engagement at the Federal Reserve Bank of Minneapolis. She focuses on deepening the Bank’s understanding of housing affordability, concentrating on effective housing policies and practices that make a difference for low- and moderate-income families in the Ninth Federal Reserve District.
Maxine Xu is a data scientist in the Minneapolis Fed’s Community Development and Engagement division, where she develops data tools and leads analyses to explore issues affecting the economic well-being of low- to moderate-income communities.