In recent years, a staple of the business news has been the record profitability of banks in the Ninth District and the nation, a far cry from the 1980s and early 1990s when banks were recovering from the worst banking crisis since the Great Depression. What were the sources for the increased earnings?
As a review of 1997 shows, most banking income still comes from traditional lending activities, but income from nonlending sources has come to play a larger role over the last five years. Improved expense control also helps to explain increased profitability. However, these changes in earnings sources are not uniform across the district's small and large banks. The implications of these changes could include large bank earnings that are less sensitive to interest rate changes, as well as the potential for earnings vulnerability at smaller banks.
Sources of profitability in 1997
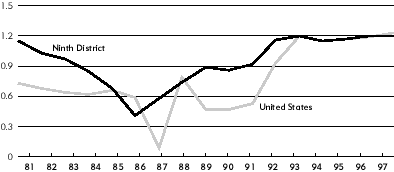
In 1997, banks across the country repeated their record returns from last year (see graph below). Despite the talk of new banking products and activities, the largest source of income for Ninth District banks in 1997 came from the most traditional of bank activities—lending and investment. In 1997, interest and fees on loans made up 80 percent of banks' interest income and were the largest source (64 percent) of Ninth District bank earnings. (The table at the bottom of the page breaks out income sources and expenses.)
PROFITABILITY OF NINTH DISTRICT AND U.S. BANKS
Return on Average Assets, 1981-1997

District banks also earned a substantial part of their income, about 12 percent, from investments and dividends from securities, the bulk of which have very low credit risk due to their issuance by, or support from, the federal government.
All other earnings generated from normal operations in district banks—20 percent in 1997—were from noninterest sources. About 40 percent of noninterest income was from fees earned from nonlending products and services provided to consumer and commercial customers. These services range from issuing money orders, to selling insurance, to "servicing" loans (that is, administering and distributing the loan payments of a borrower). Another big chunk of noninterest income (26 percent) comes from service charges and fees on, for example, deposit and checking accounts and automated teller machine transactions. Noninterest income from these often controversial service charges and fees has remained at near the same percent over the last five years. Finally, banks also earn noninterest income from trust services whereby, for example, they invest funds for the benefit of clients.
Banks must spend money to earn money, and one cannot understand profitability without examining bank expenses. The interest that banks paid to their suppliers of funds, mainly depositors, equaled about 75 percent of their total expenses in 1997. The rest of the banks' expenses (25 percent) relate to noninterest costs such as salaries and benefits of employees, income taxes and a variety of items including marketing, rent or mortgage payments. Another reduction to banks' income comes from "provisioning," that is, the setting aside of funds in reserves to absorb future losses on loans. The relatively good quality of bank loans and the accumulation of loan loss reserves in the early 1990s have allowed banks to maintain their reserves without significantly increasing provision expenses in the current year.
Changes in profitability, 1992 to 1997
How have other sources of bank profitability changed over time? Ninth District banks' net income or profit was up a healthy 23 percent from 1992 to 1997. Part of this increase came from higher net interest income, the difference between what banks earned from interest on loans and securities and what they paid depositors.
Net interest income rose by 12 percent over the five-year period. However, the biggest gain in bank earnings over that time came from noninterest income. Noninterest income grew by 34 percent between 1992 and 1997—nearly three times as fast as interest income.
The other major improvement in Ninth District banks' profitability over the last five years came from improved expense control. Overhead expenses increased at a slower rate than interest and noninterest income, just 10 percent between 1992 and 1997.
Profits at small and large banks
The discussion so far has looked at Ninth District banks as a whole, as if there were one very large bank in the district. While useful in providing a general profile of profitability, this approach obscures differences between district banks. Indeed, there are important variances in earnings between the smaller banks, which constitute the majority of banks in the district, and larger banks, which control most the district's banking assets.
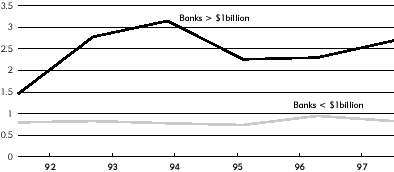
The most important difference in profitability between the district's large ($1 billion or more in total assets) and small banks concerns noninterest income. Noninterest income made up an average of 27 percent of total income in the district's large banks between 1992 and 1997, compared with 12 percent for smaller banks. Since 1992, noninterest income as a percent of assets increased 83 percent in the district's largest banks but was essentially flat in smaller banks (see graph below).
USE OF NONINTEREST INCOME BY NINTH DISTRICT AND SMALL BANKS
Noninterest Income/Average Assets, 1992-1997

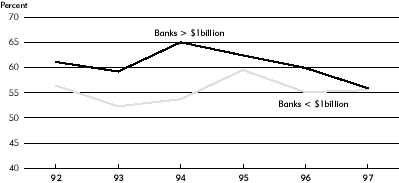
The district's large and small banks also exhibit a different trend in the control of overhead, or noninterest expenses. A common measure of a bank's expense management is its efficiency ratio. This ratio is the bank's noninterest expenses divided by net interest and noninterest income and is used to measure how cost efficiently banks use overhead expenses in producing income. A lower ratio is believed to reflect more cost efficient revenue production. Since 1994, this ratio has improved for the district's largest banks, but remained stable for smaller district banks (see graph below).
COST CONTROL OF NINTH DISTRICT LARGE AND SMALL BANKS
Efficiency Ration, 1992-1997

Implications
What are the implications of the accounting data we have reviewed? First, the increase in the use of noninterest income by large banks could make their earnings less sensitive to changes in interest rates, all else equal. The ability to earn noninterest income and to diversify income sources could increase even more if Congress or regulators provide banks with additional rights to bolster their involvement in nonbanking activities, such as the sale and underwriting of insurance or securities.
Second, small banks' relatively high reliance on income from loans could be vulnerable in the future due to increased competition. Large banks, for example, could make use of new technologies to make loans to the current customers of small banks, increasing the competition for small banks and reducing how much they can earn from lending. (An article in the Minneapolis Fed's Region magazine, "Small Business Loans, Small Banks and a Big Change in Technology Called Credit Scoring," September 1997, discusses this threat in more detail.)
BREAKOUT OF INCOME AND EXPENSES
FOR NINTH DISTRICT BANKS IN 1997
Income
| Interest Income | Percent of Interest Income | Percent of Total Income |
|---|---|---|
| Interest and fee income from loans and leases | 80 |
|
| Interest and dividend income from securities | 15 |
|
| Other | 5 |
|
| TOTAL | 100 |
80 |
| Noninterest Income | Percent of Noninterest Income | Percent of Total Income |
|---|---|---|
| Income from trust activities | 16 |
|
| Service charges on deposit accounts | 26 |
|
| Trading revenue | 3 |
|
| Other fee income | 39 |
|
| All other interest income | 16 |
|
| TOTAL | 100 |
20 |
Expense
| Interest Expense | Percent of Interest Expense | Percent of Total Expense |
|---|---|---|
| Interest on deposits | 75 |
|
| Interest paid on other borrowed money | 25 |
|
TOTAL |
100 |
42 |
| Noninterest Expense | Percent of Interest Expense | Percent of Total Expense |
|---|---|---|
| Salaries and benefits | 42 |
|
| Buildings and equipment | 12 |
|
| Other | 46 |
|
| TOTAL | 100 |
45 |
| Expense | Percent of Total Expense | |
|---|---|---|
| Expense on provisions to the loan loss reserve | 3 |
|
| Income taxes | 10 |
|


