Authors

Toby Madden
Regional Economist

Results from the Minneapolis Fed's business outlook poll and forecasting models point to a growing, albeit slower, economy in 2008 compared with 2007. Residential construction and real estate will likely continue to drag on the economy. Employment forecasts point to mild growth, but with higher unemployment rates in Minnesota and Wisconsin. The manufacturing sector has slowed recently; however, poll respondents are optimistic for 2008. The agriculture sector enjoyed a strong year in 2007, and signs point to a good 2008.
Slow home building and sales
Residential construction and real estate put on the brakes in 2007. Housing units authorized in district states decreased 24 percent for the first 10 months of 2007 compared with the same period last year. Meanwhile, third quarter existing home sales decreased 13 percent compared with the third quarter a year ago. In addition, home prices decreased slightly in the Minneapolis-St. Paul area, but still showed moderate gains in Fargo, N.D., and Sioux Falls, S.D.
On balance, the results from the Minneapolis Fed's business outlook poll and forecasting model point to slower home building in 2008. The outlook poll shows that 79 percent of respondents expect slower home starts in their communities, and the forecasting model predicts slower growth in Minnesota and North Dakota, but increases from low levels in Montana, South Dakota and Wisconsin.
Activity in the housing sector impacts other areas of the economy, from suppliers of home building products to mortgage lenders. According to results of the Minneapolis Fed's business poll, just over half of respondents predict that current conditions in the housing market will not affect their sales or profits in 2008, while about 40 percent expect a negative impact. About 25 percent of respondents expect some impact on employment and investment in plant and equipment. While the housing market is not sinking all boats, it is rocking a few sectors—respondents from finance, insurance and real estate, construction and retail were the most concerned.
Unemployment rates increase in Minnesota
Slowness in the housing sector may be one reason unemployment rates in Minnesota increased 0.7 percentage points in October 2007 compared with a year ago. Only Illinois, Florida, Nevada and California had higher percentage point increases in their unemployment rates in October 2007; the latter three states have often been cited as facing particular economic difficulties associated with slow residential real estate and construction activity.
Minnesota's employment growth slowed to a trickle in October 2007 compared with a year ago and posted decreases in jobs related to the housing industry, including wood product manufacturing, building materials dealers, and real estate and rental leasing. Each of these areas posted larger proportional decreases in Minnesota compared with the United States.
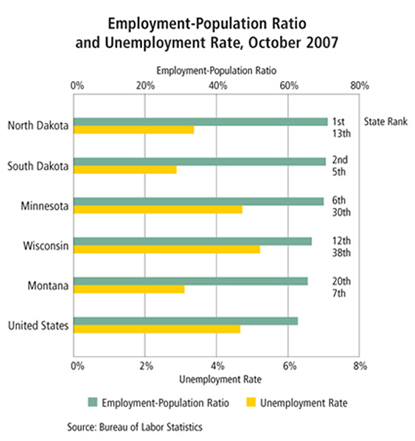
However, Minnesota's unemployment rate is not the only tool to measure the robustness of the state's employment activity. While the unemployment rate measures the percentage of labor force participants who do not have a job but are looking for work or are waiting to be called back from a layoff, the employment-population ratio measures the percentage of working-age people who are employed.
Some economists argue that the employment-population ratio is a more meaningful picture of employment conditions, in part because of difficulty determining whether a person not working is in the labor force (not employed and looking for work). Despite the drop in the unemployment rate, Minnesota, as well as other district states (not including Michigan), ranks high nationally on the employment-population ratio (see chart).
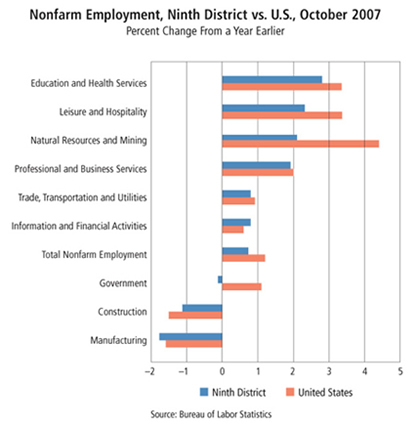
Districtwide employment growth from October 2006 to October 2007 was strongest in education and health services (+2.7 percent), leisure and hospitality (+2.2 percent), natural resources and mining (+2.0 percent) and professional business services (+1.9 percent) (see chart). Employment decreased in manufacturing (-1.6 percent), construction (-1.4 percent) and government (-0.1 percent).
The Minneapolis Fed's forecasting model predicts that employment will grow modestly in all district states in 2008, but at rates generally slower than in 2007 and historical averages. At the same time, unemployment rates are expected to increase slightly in Minnesota and Wisconsin, suggesting that the labor force is expected to grow faster than jobs in these areas over the next year.
Manufacturing to grow, wages and prices stable
Despite decreases in manufacturing employment from October 2006 to October 2007, respondents to Minneapolis Fed's business outlook poll and survey of manufacturers are optimistic for the coming year, including expected increases in sales, profits and production and slight increases in employment and investment. Furthermore, monthly surveys of manufacturing activity in Minnesota, North Dakota and South Dakota conducted by Creighton University (Omaha, Neb.) show that manufacturing activity has expanded in almost every month over the past five years; however, activity in November slowed in Minnesota and South Dakota.
Wage increases for manufacturing workers grew 3.3 percent during the three-month period ended in October, with larger increases for Wisconsin workers. Nevertheless, respondents to the business outlook poll expect wage increases for all workers in their communities to remain modest.
Overall price increases have been moderate. In October 2007, the consumer price index minus the volatile food and energy sectors was up 2.2 percent from a year earlier. However, adding prices from the food and energy sectors boosts the overall CPI increase to 3.5 percent. Respondents to the business outlook poll indicated increased expectations for inflation in 2008 compared with last year's poll.
Gasoline prices have been blamed for biting into consumer budgets. In Minnesota, gasoline prices were more than 60 cents per gallon higher in early December compared with a year ago. Adding in higher energy costs, respondents to the business outlook poll seem concerned about consumer spending in their communities during 2007. More than twice as many respondents expect consumer spending levels to decrease during 2007 as respondents who expect increases. However, respondents are much more optimistic about sales of their own products and services.
An outstanding year in agriculture
Decent range conditions, large harvests, increased demand and strong commodity prices put a smile on agricultural producers' faces in 2007. Moisture conditions improved across most of the Ninth District, which aided farmers and ranchers alike. Despite a midsummer dry spell and then flooding in some areas, the harvest for most district crops was good. More ethanol and biodiesel plants went online in 2007, boosting demand for corn and soybeans. Major droughts around the world cut wheat supplies. A lot of these factors drove prices for wheat, corn and soybeans to near record levels. In addition, cattle and dairy prices remained robust. The outlook for 2008 is generally positive, with good field conditions and strong estimated demand and prices. However, many producers worry that big increases in input costs will hurt future profits.
It appears that 2007 was one of the best years ever for Ninth District producers. Demand for grains increased substantially, as recently opened and existing ethanol plants consumed more corn. Meanwhile, world production of wheat was hampered by drought in Australia. These and other factors put upward pressure on prices. Prices for the major agricultural commodities were up from 2006. Milk and corn prices were up about 50 percent; wheat, 25 percent; soybeans, 14 percent; and choice steers, 8 percent. Hog prices dipped slightly, about 1 percent, from solid 2006 levels.
Farmers anticipated the demand from ethanol producers and planted more corn acres and reduced soybean acres. Corn production in Minnesota, Montana and the Dakotas of over 2 billion bushels was an increase of almost 30 percent from 2006. Meanwhile, district soybean and sugar beet production dipped 14 percent and 6 percent, respectively, from 2006.
The outlook for 2008 is upbeat. According to the Minneapolis Fed's third-quarter (October 2007) agricultural credit conditions survey, the outlook for farm profits is very strong, with 73 percent of responding lenders expecting increased income and only 5 percent expecting decreased income. Due to bioenergy needs, crop demand will remain vigorous. According to U.S. Department of Agriculture forecasts, 2008 prices for cattle and hogs will remain at about the same robust 2007 levels, and prices for corn, soybeans and wheat will increase substantially. However, cash rents, fertilizer, fuel, seed and other cost increases will likely eat up a good portion of the revenue increases.
| AVERAGE FARM PRICES | ||||
|---|---|---|---|---|
| 2004/ 2005 |
2005/ 2006 |
Estimated 2006/2007 | Projected 2007/2008 | |
| (Current $ per bushel) | ||||
| Corn | 2.06 |
2.00 |
3.04 |
3.35-3.95 |
| Soybean | 5.74 |
5.66 |
6.43 |
9.25-10.25 |
| Wheat | 3.40 |
3.42 |
4.26 |
6.20-6.60 |
| 2005 | 2006 | Estimated 2007 | Projected 2008 |
|
| (Current $ per cwt) | ||||
| All Milk | 14.14 |
12.90 |
19.05-19.15 |
17.70-18.60 |
| Choice Steers | 87.28 |
85.41 |
91.98 |
87.00-94.00 |
| Barrows & Gilts | 50.05 |
47.26 |
46.86 |
44.00-47.00 |
Source: |
||||


