
By Sam Schulhofer-Wohl and Richard M. Todd1
Among public health experts, it is well known that persistently high mortality (death) rates prevail in certain regions of the United States, such as portions of the Mississippi Delta and Appalachia. However, a similar but less noted pattern of persistently high mortality rates prevails in a band of counties in the Northern Plains and Midwest that have a high share of residents who are American Indian or Alaska Native (AIAN) and who live on Indian reservations.2 We think this persistent pattern calls for better data and more attention from public health experts and policymakers.
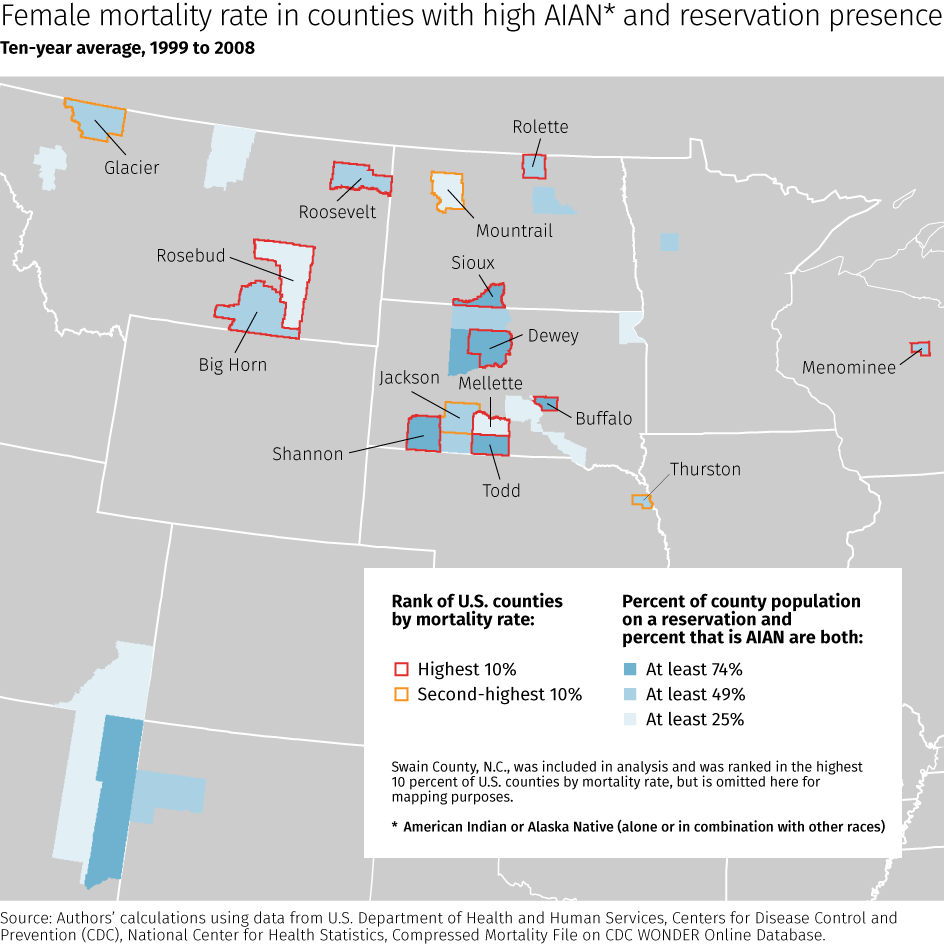
We base our views on an analysis of county mortality statistics from the Centers for Disease Control and Prevention. The statistics describe the overall mortality rate for an entire county; that is, for all individuals in the county, of any race, whether they live on a reservation or not. We average mortality rates over ten-year periods to smooth out random year-to-year variation. Equivalent mortality statistics are not available for reservations alone, so we focus on 30 counties in the contiguous 48 states that have high shares of both AIAN residents and reservation residents.3
Among these 30 counties are several where overall mortality rates have been consistently far above the national average for decades. For example, for four decades since the late 1960s, the age-adjusted mortality rate4 for women (of all races) in American Indian-dominated Menominee County, Wis., has ranged between the highest and fourth-highest among all counties in the 48 states. The county’s mortality rate for men also has ranked in the top 10 percent of counties over this period. Other counties with a moderate to very high AIAN presence and high mortality rates recently and for all or most of this period lie primarily in the Northern Plains area. As shown in the accompanying table, they include Rolette and Sioux counties in North Dakota; Thurston County in Nebraska; Big Horn, Glacier, and Roosevelt counties in Montana; and Buffalo, Corson, Dewey (especially for males), Shannon, and Todd counties in South Dakota. As shown in the map below, these counties, along with Menominee in Wisconsin, constitute a regional cluster of rural, racially concentrated counties whose persistently high death rates parallel those in the more widely recognized Mississippi Delta and Appalachian areas of high mortality.
The rankings above are based on age-adjusted mortality rates for the entire population, by gender. However, other mortality indicators also are generally high in this cluster of counties, including mortality by specific age ranges (e.g., children, teens, young adults, middle-aged adults, and older adults) or after statistically controlling for factors such as poverty and population density. Furthermore, so-called non-natural causes of death (e.g., accidents, suicide, murder, and poisoning), although often occurring at a high rate in these counties, are not the primary cause of the high overall death rates. Rates of death by natural causes are persistently quite high in most of the counties in this high-mortality cluster.
These statistics paint a sobering picture of lives cut short in several counties in the Northern Plains and Wisconsin where AIAN and reservation populations are high. At the same time, other similarly AIAN-influenced counties in that region and elsewhere across the 48 states have much lower mortality rates, sometimes well below the national average.
These large differences among counties with a high AIAN and reservation presence suggest that there may be conditions or best practices in the low-mortality AIAN communities that could be replicated to reduce mortality rates in other AIAN communities. This will require a better understanding of why mortality rates are so high in some AIAN communities and yet quite low in others. A critical first step would be to create more geographically precise data on health and mortality specifically for American Indian reservations and other communities with high AIAN populations. With better data leading to better research and a deeper understanding of public health challenges and best practices, perhaps the pattern of certain AIAN-dominated counties consistently ranking as mortality hotspots can be broken.
Mortality Rate Rankings Data [xlsx]
Female Mortality Rate in Counties With High AIAN and Reservation Presence - Large Map [png]
Endnotes
1 Sam Schulhofer-Wohl (email: Samuel [dot] Schulhofer-Wohl [at] mpls.frb.org) is Senior Vice President and Director of Research at the Federal Reserve Bank of Minneapolis. Richard M. Todd (email: dick [dot] todd [at] mpls.frb.org) is Vice President in Community Development at the Federal Reserve Bank of Minneapolis and Advisor to the Bank’s Center for Indian Country Development. The views expressed here are theirs and not necessarily those of the Federal Reserve Bank of Minneapolis or the Federal Reserve System.
2 Using data from the 2010 decennial census, we define a county as having a very high AIAN presence if at least 74 percent of the residents identify as AIAN (alone or in combination with other races) and also at least 74 percent reside on an Indian reservation. Additional counties where at least 49 percent identify as AIAN and 49 percent reside on a reservation are labeled as having a high AIAN presence, and a further group of counties where at least 25 percent identify as AIAN and 25 percent reside on a reservation are labeled as having a moderate AIAN presence. As shown in the accompanying table, we examine 7 counties with a very high AIAN presence, 12 with a high presence, and 11 with a moderate presence.
3 A separate summary of our findings, presented at the National Congress of American Indians Policy Research Center Tribal Leader/Scholar Forum on June 28, 2015, is available at http://www.ncai.org/policy-research-center/initiatives/tribal-leader-scholar-forum.
4 Our age-adjusted mortality rates include mortality data for individuals of all ages but are adjusted for each age group’s share of the population, so that rates can be meaningfully compared across counties with very different percentages of young, middle-aged, and older individuals.


