Author


Despite treading water in 2016, Ninth District manufacturers were expecting moderate growth in the year ahead, according to a survey conducted in November and early December by the Federal Reserve Bank of Minneapolis and the Minnesota Department of Employment and Economic Development.
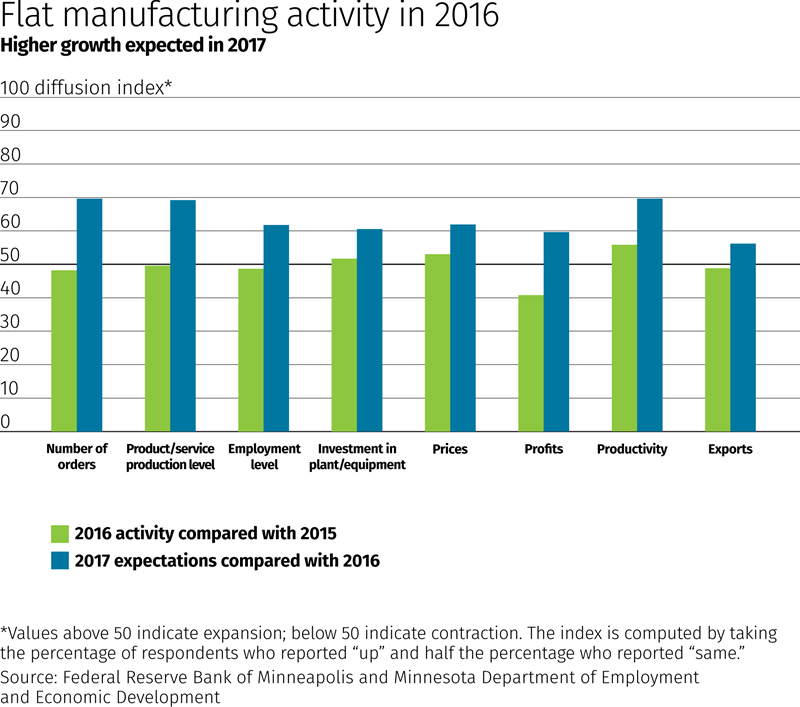
The survey reflects responses from 484 manufacturing operations of various sizes across district states. Respondents reported increases on average in productivity and capital expenditures in 2016, and in the prices charged for their products, but every other indicator was flat or down slightly from the previous year. Most survey results are summarized as an index representing changes in activity from 2015 to 2016, and 2016 activity versus expectations for 2017 (see chart).
Two-thirds of survey respondents reported that orders had declined or stayed the same. Employment was unchanged at about half of firms; among the remainder, slightly more reported that employment fell rather than rose at their locations.
With respect to overall production, nearly the same proportion of firms reported increases as did decreases, with slightly more saying that output was unchanged. Profitability was perhaps the most sluggish indicator; 44 percent of respondents said that profits fell in 2016. Wages grew 2 percent to 3 percent on average, with slightly higher growth in employee benefits, manufacturers reported.
In contrast, the manufacturing outlook for 2017 was much rosier: Respondents anticipated growth across the board this year, with heightened expectations for every indicator compared with last year.
Prospects were strongest for orders, which more than half of respondents expected to increase in 2017. The outlooks for productivity and production were nearly as strong. Though still positive overall, expectations were weakest for exports, with two-thirds of respondents expecting no change in the coming year. These low expectations may reflect uncertainty about the global economy.
A third of manufacturers expected employment to increase at their operations in 2017, while only 10 percent anticipated layoffs. On average, wages and benefits were expected to increase slightly less than last year.
A special question asked manufacturers about the impact of the Affordable Care Act, which increased health insurance requirements for many employers, on their business over the past year. A strong majority of respondents (71 percent) said that the ACA increased their operating costs, and nearly two-thirds reported that it reduced their profits. However, most respondents reported no effect on hiring, wages, prices charged to consumers, automation or outsourcing.
Respondents were fairly evenly split on the ACA’s impact on health care benefits offered to employees. Similar shares of manufacturers claimed that it decreased benefit levels as said that it had no effect, while more than a quarter of respondents said that the law increased benefits.
The optimism of survey respondents was not restricted to their operations; they were also upbeat about the economic outlooks of their respective states. Most respondents expected state employment, business investment, consumer spending, corporate profits and overall economic growth to increase or remain unchanged over the coming year.
However, inflation is a concern; more than half of respondents predicted inflation would rise, and only 2 percent expected it to fall in 2017.
Manufacturing survey data
Total (484 Responses)
Business indicators in 2016, compared with 2015:
| Up | Same | Down | Diffusion Index* |
|
|---|---|---|---|---|
| Number of orders | 33% | 30% | 36% | 49 |
| Product/service production level | 32% | 36% | 32% | 50 |
| Employment level | 25% | 48% | 27% | 49 |
| Investment in plant/equipment | 34% | 37% | 29% | 52 |
| Prices | 27% | 53% | 20% | 53 |
| Profits | 26% | 30% | 44% | 41 |
| Productivity | 31% | 49% | 19% | 56 |
| Exports | 20% | 58% | 22% | 49 |
| Decrease | 0% | 1%-2% | 3%-5% | 6%-10% | >10% | Average | |
|---|---|---|---|---|---|---|---|
| Wages per worker | 2% | 22% | 31% | 39% | 3% | 3% | 2.6% |
| Benefits per worker | 4% | 35% | 17% | 25% | 12% | 7% | 2.9% |
Expected business indicators in 2017, compared with 2016:
| Up | Same | Down | Diffusion Index* |
|
|---|---|---|---|---|
| Number of orders | 52% | 35% | 13% | 70 |
| Product/service production level | 48% | 42% | 10% | 69 |
| Employment level | 33% | 57% | 10% | 62 |
| Investment in plant/equipment | 38% | 46% | 16% | 61 |
| Prices | 33% | 58% | 9% | 62 |
| Profits | 39% | 42% | 19% | 60 |
| Productivity | 46% | 47% | 7% | 70 |
| Exports | 24% | 66% | 11% | 56 |
| Decrease | 0% | 1%-2% | 3%-5% | 6%-10% | >10% | Average | |
|---|---|---|---|---|---|---|---|
| Wages per worker | 1% | 18% | 40% | 39% | 1% | 2% | 2.4% |
| Benefits per worker | 4% | 33% | 24% | 26% | 7% | 6% | 2.6% |
What is your outlook on the following state economic indicators during 2017:
| Up | Same | Down | Diffusion Index* |
|
|---|---|---|---|---|
| Business investment | 37% | 50% | 14% | 62 |
| Employment | 34% | 56% | 10% | 62 |
| Consumer spending | 32% | 52% | 17% | 57 |
| Inflation | 56% | 42% | 2% | 77 |
| Economic growth | 40% | 49% | 11% | 65 |
| Corporate profits | 34% | 48% | 18% | 58 |
| Notes * A number above 50 indicates expansion; a number below 50 indicates contraction. The index is computed by taking the percentage of respondents that reported "up" and half the percentage of the respondents that reported "same." Response rate is 18.2% Sampling error is +/- 4.4% Percentages may not add to 100 due to rounding |
||||
Full Survey Results [xlsx]
Joe Mahon is a Minneapolis Fed regional outreach director. Joe’s primary responsibilities involve tracking several sectors of the Ninth District economy, including agriculture, manufacturing, energy, and mining.