Author


This is also available on Medium.
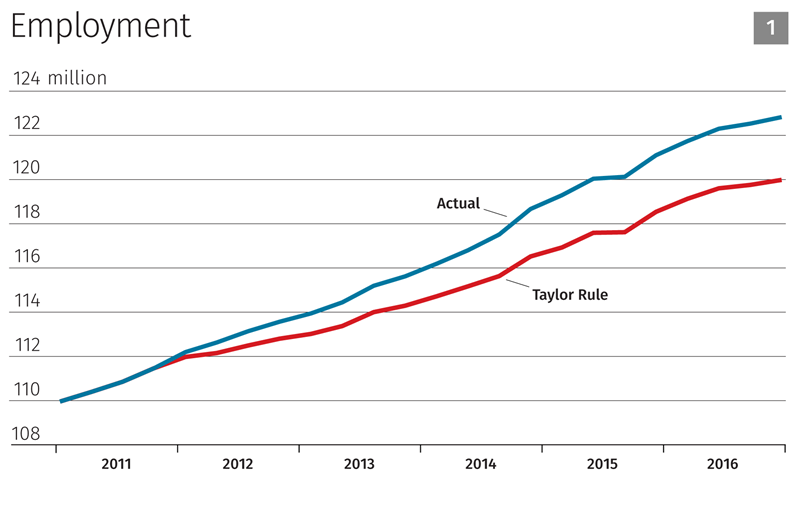
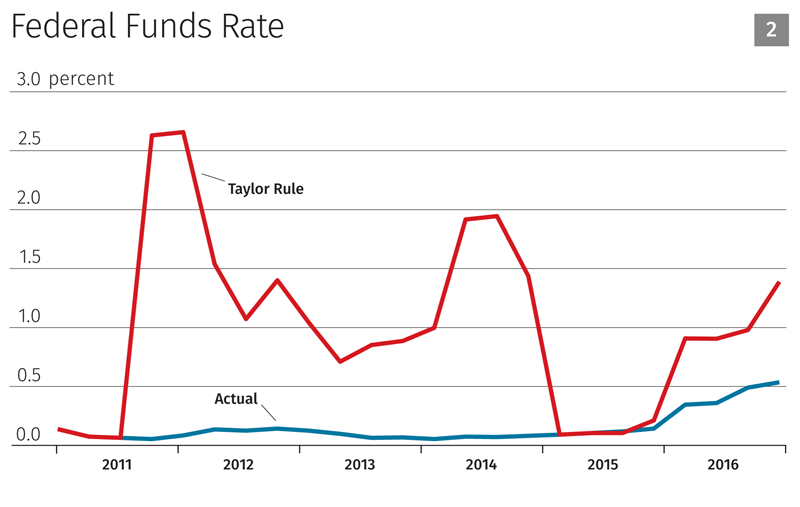
In December, I wrote an op-ed in the Wall Street Journal explaining that forcing the Federal Open Market Committee (FOMC) to mechanically follow a rule, such as the Taylor rule, to set interest rates can cause tremendous harm to the economy and the American people. My staff at the Minneapolis Fed estimates that if the FOMC had followed the Taylor rule over the past five years, 2.5 million more Americans would be out of work today. That’s enough to fill the seats at all 31 NFL stadiums simultaneously, almost 6,000 more people out of work in every congressional district. (Click here for a visual depiction of what 2.5 million people looks like.)
We acknowledge that no simulation of the economy is perfect; the model we used is one of the Federal Reserve’s primary tools for analyzing different policy options and provides an informed baseline estimate of these job losses. If people have comments or alternative techniques for estimating the Taylor rule’s effect on employment, we welcome receiving them at taylorrule@minneapolisfed.org.
The 2.5 million figure was the outcome of several simulations of the FRB/US model. FRB/US is a large macroeconomic model developed by staff at the Federal Reserve Board of Governors for forecasting, simulating alternative scenarios, and evaluating policy options. (For an overview of the model, go to: https://www.federalreserve.gov/econresdata/frbus/us-models-about.htm. A model package is available here: https://www.federalreserve.gov/econresdata/frbus/us-models-package.htm.) The calculations were conducted using the model version and database dated Sept. 21, 2016.1 This package includes all model equations and coefficients as well as a database with observations on all FRB/US variables starting in the first quarter of 1968 through the second quarter of 2016 and a projection that extends roughly 100 years. The first few years of the projection are designed to be roughly consistent with the Summary of Economic Projections from the September 2016 Federal Open Market Committee meeting. Beyond that, the projection converges to an illustrative, but arbitrary steady-state path.2
FRB/US models economic expectations in two ways. One method, vector auto regression-based expectations, uses historical VARs to forecast future values of “relevant” variables. FRB/US is a large model with many variables; it is impractical to compute expectations for all variables. Under VAR-based expectations, participants in various sectors (households, firms, financial markets, etc.) focus on the variables most relevant for their decision making, replicating the structure used to estimate the model. The other treatment of expectations is referred to as “model consistent expectations.” This can be imposed sector by sector and endows participants in relevant sectors with full knowledge of the dynamics of the model (including “shocks” required to match the model to data). We ran simulations using both methods.3
Neither of these methods qualifies as a “rational expectations” approach, but both allow agents in the model to be forward looking. VAR-based expectations are restricted by historical experience and may not allow for optimal behavioral responses to changes in policy rules. In this sense, agents have too little information. Model consistent expectations, on the other hand, essentially give agents perfect foresight about policy as well as the paths of shocks to the model equations. In this sense, agents have too much information.
FRB/US has several built-in policy rules, including a few versions of the Taylor rule. The most basic Taylor rule in FRB/US (RFFTAY) is a function of the output gap between actual and potential economic output (as defined in FRB/US) and deviations of four-quarter core PCE inflation from the inflation target. The default coefficient on the output gap is 1.0, but we changed it to 0.5 to match the original Taylor (1993) output gap coefficient. In addition, there is a very general rule in FRB/US (RFFGEN). The default coefficients for this rule treat the Federal funds rate as a function of the output gap and total PCE inflation using the Taylor (1993) coefficients.
We performed our simulations using both Taylor rules, RFFTAY and RFFGEN, and both expectations methods, VAR-based and model consistent. The simulations were conducted by setting the error terms on the policy rule equations (including upstream policy rule equations that RFFTAY and RFFGEN feed into) to zero and resolving the model under VAR-based and model consistent expectations. The funds rate evolved endogenously in each simulation, given the realizations for the output gap and the inflation in a particular simulation.
The equilibrium real funds rate (sometimes referred to as r*) for monetary policy rules is captured in the FRB/US variable RSTAR. It can be held constant (the default setting) or evolve as a function of the economy. We set the value of RSTAR to 2.0 percent to match the original Taylor (1993) specification. The database assumes a value of 0.98 percent.
There are several measures of employment in FRB/US. We focused on two: employment in the business sector (LEP) and civilian employment (LEH). We chose the former because it is the head-count version of the labor input in the model’s production function and the latter because it corresponds to the broadest measure reported from the household survey.
We conducted simulations using all four possible combinations of two expectations assumptions and two policy rules over a five-year period beginning with the fourth quarter of 2011, and we reported the employment decrease as an average of the LEP and LEH measures of employment. (The average job loss across the eight measures is actually 2.75 million; our 2.5 million figure therefore leans to an undercount of actual economic harm.) The accompanying charts show the actual and simulated paths for business sector employment and the federal funds rate when using total PCE inflation in the Taylor rule under VAR-based expectations.
Endnotes
1 The last two quarters of 2016 are projections.
2 FRB/US does not have an analytical steady state.
3 We only imposed model consistent expectations for financial markets and wage-and-price setters.
References
Taylor, John B. 1993. Discretion Versus Policy Rules in Practice. Carnegie-Rochester Conference Series on Public Policy 39: 195-214.