Author


Article Highlights
- Farm incomes, capital spending fall
- Moderate decrease in farmland values
- Loan repayment rate tumbles as loan renewals increase
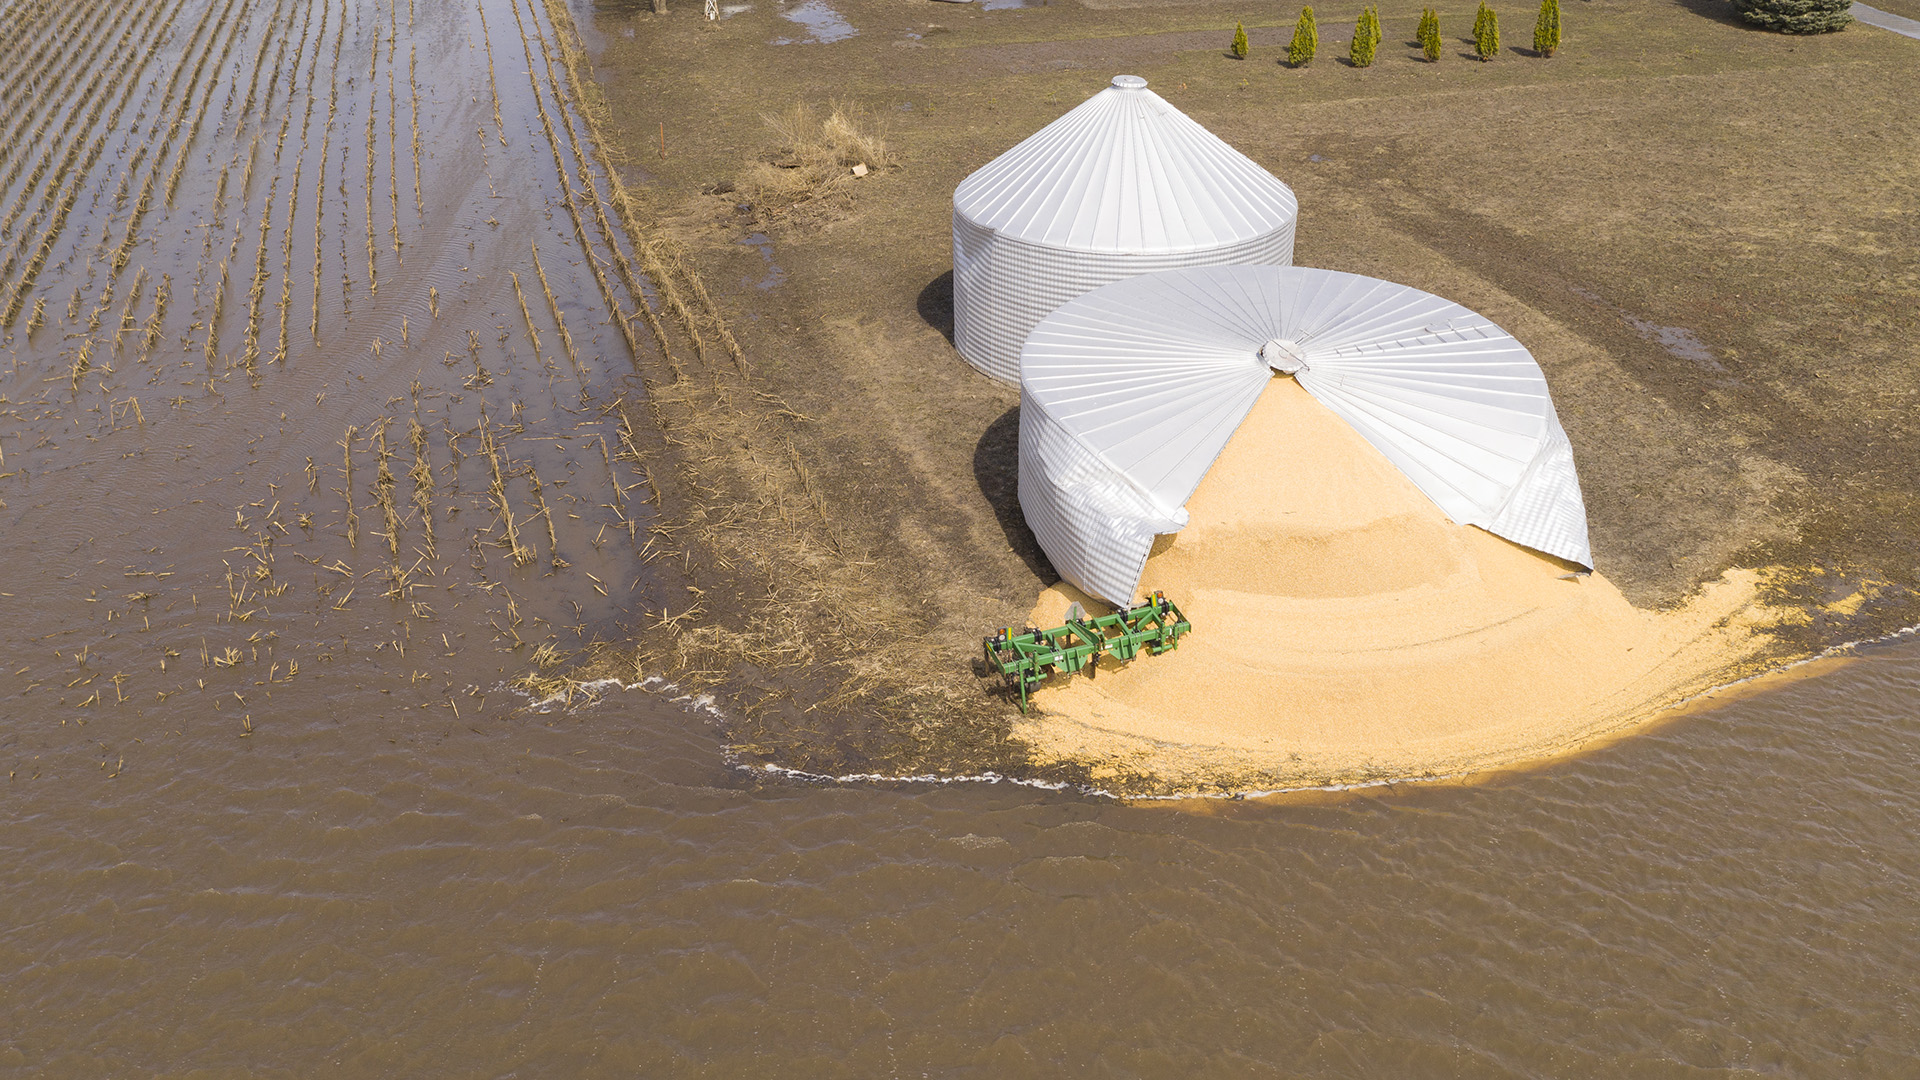
“Crops are behind, and we will need warmer weather and an extended fall for our crops,” wrote a Wisconsin banker about current agricultural conditions in the wake of recent flooding. “Yields have been affected and will be lower in our area.”
However, that banker also noted, somewhat positively: “Overall, with better prices, I think we are in a better position than the last three years.” These comments reflect numerous others expressing guarded optimism along with concerns in a recent Minneapolis Fed survey.
Farm incomes fell from April through June relative to a year earlier, according to results of the second-quarter (July) agricultural credit conditions survey. Spending on capital equipment and farm household purchases also decreased. Falling incomes pushed the rate of loan repayment down slightly, while renewals and extensions increased, though a majority of lenders reported that both were flat.
Respondents noted that cropland values generally increased slightly. Although the third-quarter outlook is for continued contraction, fewer respondents predicted decreases in income, capital expenditure, and household spending over the next three months than in the past three months.
Farm income, household spending, and capital investment
More than three-in-five district lenders responding to the survey (62 percent) reported that farm incomes decreased in the second quarter of 2019 from a year earlier, while only 8 percent said that incomes increased (see chart). Capital spending was also down, with 64 percent of lenders saying it decreased compared with 5 percent claiming it increased.
Household spending within the district was more flat, with slightly more than half of lenders reporting no change, while more noted decreases than increases.
Conditions appeared most stable in Wisconsin, where half of lenders reported increased or unchanged income, than in other district states. North Dakota had the highest share reporting falling incomes at 74 percent. Though decreases in capital spending were the norm throughout the region, a Minnesota lender noted that they were, “seeing a bit more optimism with higher grain prices. A bit more willing to buy equipment.”

Minnesota experienced the most widespread decrease in income in the district, as 79 percent of lenders in the state reported decreased farm income, while 92 percent indicated that capital spending fell. Lenders in Montana were the least negative, with 42 percent of those surveyed in the state reporting falling incomes in the quarter and the balance reporting flat income. Montana respondents also reported household and capital spending decreases least frequently in the district.
Loan repayments and renewals
In spite of the optimism, the rate of repayment on agricultural loans fell, and renewals slightly increased, as expected during leaner times for farm households. Compared with a year earlier, loan repayment rates decreased for 44 percent of respondents, while 54 percent reported that rates were unchanged. A slightly larger majority of lenders, 58 percent, stated that the number of renewals or extensions has held steady, but 42 percent saw increased renewal activity.
Demand for loans, required collateral, and interest rates
Falling incomes also drove increases in demand for loans by farm households in the second quarter. About 40 percent of respondents indicated that loan demand increased from a year ago, only slightly lower than the proportion that noted unchanged loan demand (42 percent). Collateral requirements were unchanged, according to a solid majority of lenders surveyed—79 percent. Fixed and variable interest rates for operating, machinery, and real estate loans all decreased modestly from the previous quarter.
Cash rents and land values
Consistent with surveys in recent quarters, the second-quarter results generally pointed to a moderate decrease in land values. Cash rents for agricultural land also fell slightly. The average value for nonirrigated cropland in the district decreased by 1.7 percent from a year earlier, according to survey respondents. Irrigated land and ranchland values were nearly flat, with the former decreasing and the latter increasing less than half a percent. The district average cash rent for nonirrigated land decreased by less than 1 percent from a year ago, while rents for irrigated land fell more than 3 percent.
The decrease in land values was mostly consistent across the district, except in Wisconsin, where nonirrigated land values increased slightly. Cropland prices fell the most in South Dakota, where lenders reported that nonirrigated land values dropped nearly 4 percent compared with a year earlier. Rents for the same class of land fell 3 percent in Minnesota, but increased by almost 5 percent in North Dakota.
Outlook
Expectations for the coming months were slightly pessimistic, on balance. Across the district, almost half of lenders predicted that farm income will decrease in the third quarter of 2019. However, 18 percent expected increases. Slightly more than half expected capital spending to fall, and about a third predicted decreases in farm household spending. Loan demand was generally forecast to rise in the upcoming quarter (35 percent expected increases), while the collateral requirements were mostly flat.
Some of this pessimism may be weather-related. Prompted by late-season snow, heavy rains, and flooding across the district, the second-quarter survey contained a special question on the impact of severe weather on overall conditions (including local infrastructure, housing, and so on) this year. While a third of lenders said there was no impact on their lending areas, 45 percent said the weather events had a modest impact, and 23 percent reported significant impacts.
State Fact Sheet Q2 2019
Percent of respondents who reported decreased levels for the past three months compared with the same period last year:
| MN | MT | ND | SD | WI | Ninth District | |
| Rate of loan repayments |
41
|
14
|
47 | 58 | 33 | 44 |
| Net farm income |
62
|
57 | 74 | 58 | 50 | 62 |
| Farm household spending |
44
|
- | 42 | 37 | 50 | 38 |
| Farm capital spending |
63
|
29 | 68 | 78 | 50 | 64 |
| Loan demand |
19
|
29 | 16 | 16 | 17 | 18 |
Percent of respondents who reported increased levels for the past three months compared with the same period last year:
| MN | MT | ND | SD | WI | Ninth District | |
| Loan renewals or extensions |
41
|
14 | 63 | 32 | 50 | 42 |
| Referrals to other lenders |
8
|
29 | 6 | 16 | - | 11 |
| Amount of collateral required |
13
|
-
|
11 | 42 | - | 21 |
| Loan demand |
33
|
14
|
47
|
42
|
67 | 40 |
State Fact Sheet Outlook Q2 2019
Percent of respondents who expect decreased levels for the next three months:
| MN | MT | ND | SD | WI | Ninth District | |
| Rate of loan repayments |
27
|
40
|
32
|
59
|
33
|
36
|
| Net farm income |
27
|
57
|
58
|
58
|
33
|
46
|
| Farm household spending |
30
|
-
|
33
|
37
|
33
|
32
|
| Farm capital spending |
44
|
29
|
50
|
74
|
33
|
64
|
| Loan demand |
15
|
17
|
5
|
17
|
17
|
12
|
Percent of respondents who expect increased levels for the next three months:
| MN | MT | ND | SD | WI | Ninth District | |
| Loan renewals or extensions |
24
|
40
|
37
|
41
|
33
|
33
|
| Referrals to other lenders |
8
|
33
|
6
|
13
|
-
|
10
|
| Amount of collateral required |
12
|
-
|
11
|
56
|
-
|
19
|
| Loan demand |
19
|
33
|
47
|
35
|
67
|
35
|
Note: The Upper Peninsula of Michigan is not part of the survey.
Appendix:
Joe Mahon is a Minneapolis Fed regional outreach director. Joe’s primary responsibilities involve tracking several sectors of the Ninth District economy, including agriculture, manufacturing, energy, and mining.


