Author


The story has become a familiar one: Farmers in most areas of the Ninth District had good growing conditions and strong yields in 2018, but low crop prices held farm incomes down and put pressure on finances. “We are seeing the economic stress rising significantly,” said a rural banker in Minnesota. “Producers are dealing with multiple years of economic pressure, and we are seeing more operations ‘throwing in the towel.’”
Farm incomes and capital spending continued to decrease at the end of 2018, according to lenders responding to the Minneapolis Fed’s fourth-quarter (January) agricultural credit conditions survey. Falling incomes also led to decreased loan repayment rates, while loan demand, renewals, and extensions increased. Farmland values declined slightly on average, while cash rents were more stable. The outlook for the beginning of 2019 is pessimistic, with survey respondents predicting a further decline in income and capital spending.
Farm income, household spending, and capital investment
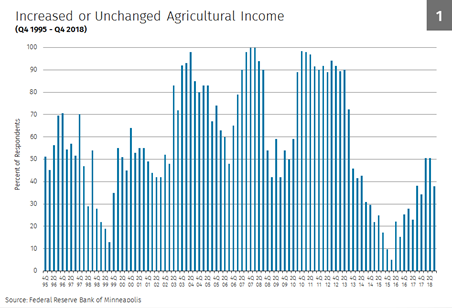
Despite good harvests, farm income continued to fall. More than half of lenders said that farm income decreased in the fourth quarter compared with a year earlier; 10 percent reported increases (see Chart 1). About two-thirds of lenders said capital spending by agricultural producers fell in the fourth quarter, and another 29 percent reported that it was flat. A majority of respondents indicated that farm household spending was unchanged, though roughly a third said it decreased.
Loan repayments and renewals
Consistent with greater financial stress, loan repayment rates decreased, while renewals ticked up. About 36 percent of the lenders responding to the survey reported a lower rate of loan repayment from a year earlier, while 61 percent indicated that repayment rates held steady. A third of lenders reported that loan renewal or extension activity increased, while almost all of the remainder noted that renewals held steady.
Demand for loans, required collateral, and interest rates
More than a third of lenders said demand for loans increased from a year earlier, while 56 percent noted no change. This was generally consistent across district states. A strong majority of lenders reported no change in collateral requirements on loans, while 11 percent said collateral requirements increased. Fixed and variable interest rates on operating, machinery, and real estate loans each increased slightly on average from their third-quarter levels, according to respondents.
Cash rents and land values
Cropland values continued to decrease somewhat in the final three months of 2018, though the pace of decline slowed compared with recent surveys. Meanwhile, cash rents increased slightly. Nonirrigated farmland values fell slightly on average across the district compared with a year earlier, while cash rents for that land increased 3 percent over 2017. Irrigated farmland values rose 2 percent on average, while ranchland values increased less than 1 percent. Lenders in North Dakota reported a surprising increase in land values, with nonirrigated land up 9.8 percent, while Wisconsin logged the biggest decrease at 3.5 percent.
Outlook
Given the role of strong harvests in bolstering farm incomes, some lenders expressed concerns about that luck running out. “A year of average yields with current commodity pricing would be very detrimental to our area’s farm operations,” a Minnesota banker commented.
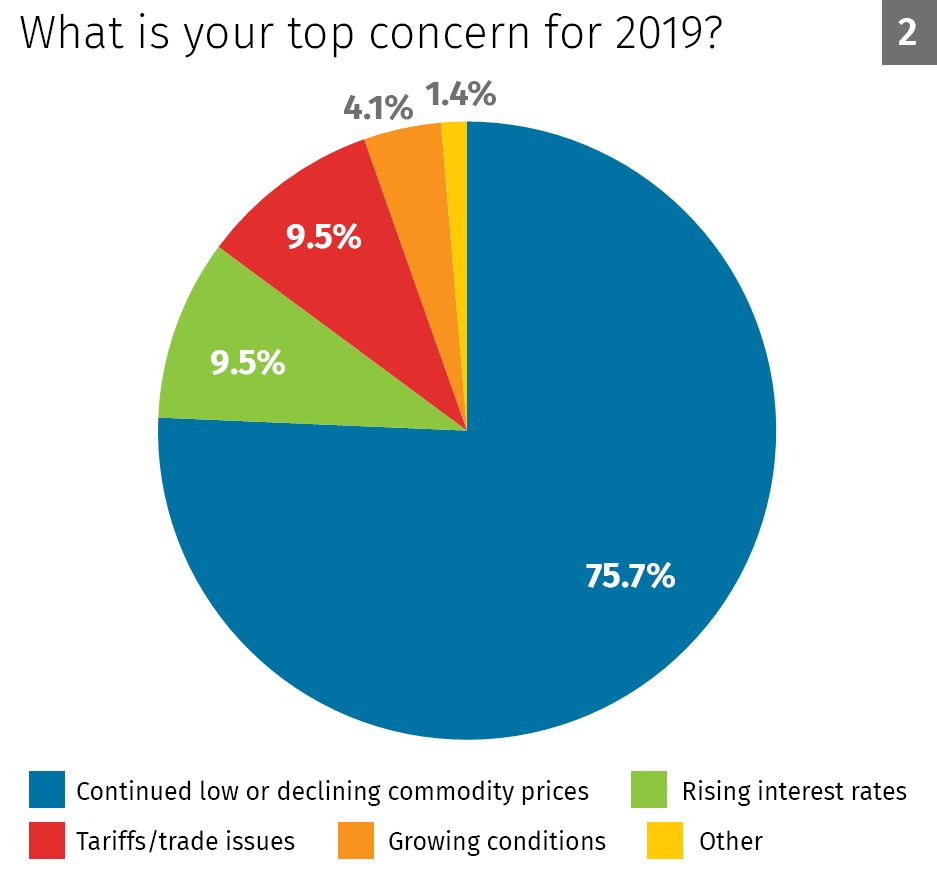
Even so, low or falling commodity prices were by far a bigger worry for the year ahead, according to results of a special question on the survey (see Chart 2). Three of four lenders cited prices as their biggest concern for 2019, compared with only 4 percent citing growing problems (severe weather or declining yields). Trade conflict and rising interest rates were each cited as the paramount concern by 10 percent of respondents.
State Fact Sheet Q4 2018
Percent of respondents who reported decreased levels for the past three months compared with the same period last year:
| MN | MT | ND | SD | WI | Ninth District | |
| Rate of loan repayments |
46
|
-
|
19 | 39 | 50 | 36 |
| Net farm income |
70
|
25 | 44 | 50 | 83 | 58 |
| Farm household spending |
37
|
25 | 27 | 24 | 83 | 35 |
| Farm capital spending |
81
|
25 | 63 | 53 | 83 | 67 |
| Loan demand |
11
|
- | - | 6 | - | 6 |
Percent of respondents who reported increased levels for the past three months compared with the same period last year:
| MN | MT | ND | SD | WI | Ninth District | |
| Loan renewals or extensions |
44
|
- | 40 | 25 | 17 | 33 |
| Referrals to other lenders |
8
|
25 | 7 | 18 | - | 11 |
| Amount of collateral required |
7
|
-
|
6 | 29 | - | 11 |
| Loan demand |
41
|
-
|
38
|
39
|
50 | 38 |
State Fact Sheet Outlook Q4 2019
Percent of respondents who expect decreased levels for the next three months:
| MN | MT | ND | SD | WI | Ninth District | |
| Rate of loan repayments |
42
|
-
|
29
|
31
|
40
|
34
|
| Net farm income |
70
|
25
|
44
|
50
|
83
|
58
|
| Farm household spending |
37
|
25
|
27
|
24
|
83
|
35
|
| Farm capital spending |
81
|
25
|
63
|
53
|
83
|
67
|
| Loan demand |
13
|
33
|
0
|
-
|
20
|
8
|
Percent of respondents who expect increased levels for the next three months:
| MN | MT | ND | SD | WI | Ninth District | |
| Loan renewals or extensions |
60
|
-
|
46
|
13
|
60
|
43
|
| Referrals to other lenders |
17
|
33
|
0
|
14
|
20
|
14
|
| Amount of collateral required |
12
|
-
|
7
|
25
|
-
|
13
|
| Loan demand |
57
|
-
|
64
|
35
|
60
|
50
|
Note: The Upper Peninsula of Michigan is not part of the survey.
Appendices:
Joe Mahon is a Minneapolis Fed regional outreach director. Joe’s primary responsibilities involve tracking several sectors of the Ninth District economy, including agriculture, manufacturing, energy, and mining.


