Author

Zachary Lundquist
Quant Analyst
Heading into 2019, agricultural producers and their lenders face another challenging year. “Storms on the Horizon – Part 1,” in the January 2019 issue of Banking in the Ninth, identified increasing credit risk in the ag industry as farm incomes have continued to decline from their 2012-13 historical highs. Since then, many producers have faced break-even or negative cash flows year over year. Consequently, farm balance sheet strength is under pressure as working capital is depleted to maintain operations, and equity capital is used to restructure debts. 1
Capital represents an entity’s resilience to adverse conditions and is therefore considered its loss-absorbing capacity, be it a producer’s resilience to deteriorating farm income or a bank’s resilience to increased credit losses from nonperforming loans. This article explores changes in the capital of banks with and without concentrations in ag lending (ag banks versus non-ag banks), given the elevated and growing credit risk present in the ag industry. 2
Banks build capital from two primary sources, external capital and retained earnings. External capital sources consist of transactions that involve capital and Treasury stock or other shareholders (e.g., a bank raises capital through the issuance of new bank stock). Retained earnings are the bank’s net income remaining after dividends are paid to shareholders. Banks usually report positive net income and therefore are in a position to grow capital and pay dividends. However, when banks lose money (negative net income), capital levels decrease unless external sources are able to offset losses. Figures 1a (ag banks) and 1b (non-ag banks) illustrate on an annual basis how banks have built capital in recent years using these two primary sources of capital formation.
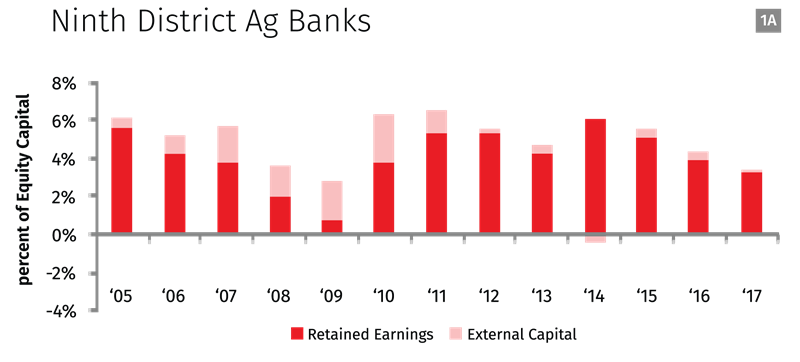
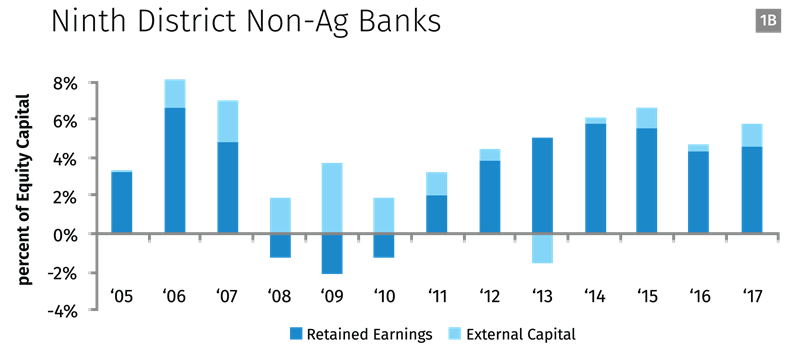
The figures illustrate that the 2008 financial crisis had a larger impact on non-ag banks, which show three consecutive years of negative retained earnings, whereas retained earnings for ag banks remained positive during the same period. Despite adverse pressure on earnings, the contribution to capital from external sources expands under stress for non-ag and ag banks alike and offsets the reductions in capital caused by the extreme losses for non-ag banks. 3 Both types of banks demonstrated an ability to raise capital from external sources during a period of stress.
Coming out of the crisis and moving into record-high farm income seasons (2012-13), ag banks reported strong annual contributions to capital (6 percent, 6 percent, 5 percent, and 4 percent, respectively) relative to non-ag banks (1 percent, 3 percent, 4 percent, and 3 percent, respectively). It is clear that ag banks were able to contribute more earnings to capital during the ag boom, but contributions have steadily declined since 2014.
Figures 1a and 1b illustrate contributions to capital but do not show the resulting capital ratios, which are used by bank regulators to determine whether capital levels are sufficient given a bank’s risk profile. Capital is commonly measured as a ratio relative to risk-weighted assets (RWA), the riskiness of a bank’s assets. This ratio is referred to as the risk-based capital (RBC) ratio. Table 1 shows changes in average RBC ratios of ag and non-ag banks before the crisis (2005-08) and after the record farm income years of 2012 and 2013 (2014-17).
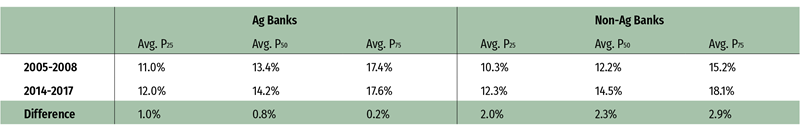
From left to right, Table 1 can be interpreted as average RBC ratios on the low end and high end (25th to 75th percentile) for ag and non-ag banks. It is clear that ag and non-ag banks have consistently built capital through external sources and retained earnings since the financial crisis, contributing to a moderate increase in their RBC ratios. In addition, average RBC ratios at both types of banks are well above the minimum threshold to qualify as well-capitalized (8 percent) during both time periods.
Table 1 shows that non-ag banks consistently held lower capital levels than ag banks prior to the crisis and have since responded by building capital to levels similar to ag banks. The difference shown in Table 1 tapers off at the higher end for ag banks but is consistent across all ranges of non-ag banks. It is important to note that nearly all of the growth in RBC ratios occurred between 2008 and 2014, with relatively little to no growth in ratios since then for ag and non-ag banks. From 2014 to 2017, the RBC ratio at the median ag bank (P50) increased from 14.12 percent to 14.37 percent and decreased from 15.07 percent to 14.20 percent at the median non-ag bank.
In summary, relative contributions to capital from ag banks have declined, and ag bank RBC ratios are relatively unchanged as ag credit conditions have deteriorated (since 2014). Ag banks and non-ag banks maintain similar capital levels, although the ag banks face more uncertain prospects in ag credit risk. However, it may be that ag banks are maintaining appropriate capital levels, and the similarity in RBC ratios to non-ag banks could be because non-ag banks were holding too little capital prior to the financial crisis, given their risk profiles.
Endnotes
1 Working capital (current assets less current liabilities) is a portion of equity capital that is used for short-term needs, such as daily operations.
2 In this report, banks with ag loans greater than or equal to 25 percent of total loans are classified as ag banks, and banks with ag loans less than 25 percent of total loans are classified as non-ag banks. This article uses publicly available Call Report data. Year-end 2018 data are not yet available. Since changes in capital are best captured on an annual basis, data end at year-end 2017. The population of banks is limited to those with $1 billion or less in total assets (95 percent of all banks and 99 percent of all ag banks).
3 Figures 1a and 1b are stacked bar graphs, where the contributions to capital are shown on a combined basis. For example, -2 percent retained earnings and 4 percent external capital in the same year represent a total contribution to capital of 2 percent.
4 RBC ratio here is calculated by dividing the average of tier 1 capital by the risk weighted assets.