Author


Climate change is global, but each individual’s contribution to it is very local, shaped not only by personal lifestyle choices—big house or small, car or bike, incandescent or LED—but by where one lives. Residents of cities with hot summers or cold winters generate more carbon emissions to cool or heat their homes than those who live in more temperate locations. Power plants themselves have different carbon footprints—coal burners generate more emissions than hydroelectric plants—so energy users in cities that rely on one or the other have a disparate impact on climate change. The median household in Memphis, for instance, is responsible for over three times the carbon emissions as its counterpart in Honolulu.
In a working paper from the Opportunity & Inclusive Growth Institute, Minneapolis Fed economist Mark Colas, with his colleague at the University of Oregon, John M. Morehouse, quantifies the effect that local government policy—land-use restrictions, specifically—has on residential carbon emissions at the national level. Such restrictions tend to raise housing costs and thus discourage people from living where regulations are strict.
Study authors
Mark Colas, assistant professor of economics at the University of Oregon, was an Institute visiting scholar in 2017-2018. His co-author on this working paper is John M. Morehouse, a University of Oregon Ph.D. candidate.
An unintended consequence might be to motivate people to choose locations that, because of climate and local power plants, have higher carbon emissions. Indeed, research by other economists suggests that this is the case. But how powerfully do land-use regulations influence where people choose to live, and thus their carbon emissions? Does regulation-emission interaction have national consequences? Is this issue simply an economist’s theoretical nightmare, or an empirically substantive worry?
It turns out that the impact is large. Colas and Morehouse estimate that if California land-use restrictions were eased to the national median level, more people would move to California as housing prices declined, leading to a 68 percent population increase in California’s cities in the long run. The nation would consume 1.1 percent less natural gas and 1.7 percent less electricity.
“Overall,” write the economists, “this leads to a 2.3% decrease in national carbon emissions” driven by lower energy use and more electricity coming from cleaner power plants. Moreover, average wages would rise for both skilled and unskilled workers because California cities have high productivity levels. In sum, relaxing land-use regulations would lead to a nearly 5 percent increase in national carbon efficiency (output-to-emissions.) Another policy option, a carbon tax, would decrease residential carbon emissions substantially, but its burden would hit Midwestern households much harder than those on the West Coast.
Updating the national regulation-emissions map
In a 2010 study, economists Edward Glaeser and Matthew Kahn estimate carbon dioxide emissions for 66 U.S. metropolitan areas and hypothesize: “It is certainly possible that land-use restrictions are actually pushing people away from lower emission areas into higher emission areas,” they write. “This topic seems to merit future research.”
Colas and Morehouse take on the challenge, updating data and building a model that enables them to examine the regulation-emission link.

They pull together data on household locations, income, rents, and energy expenditures of over 5 million U.S. households from 2012 to 2016, combine them with state-level prices to calculate energy usage, and gather data on power plant locations, emissions, and output across the country. They pool this with a measure of urban policy restrictiveness on land development, the Wharton Land-Use Regulation Index. A higher Wharton index means more stringent regulations and higher land development costs, and more inelastic housing supply curves—that is, home builders are less likely to respond to changes in price.
The nation’s metropolitan areas range widely on these various measures. Oxnard, Calif., for example, has extremely low emissions from its use of electricity but relatively high emissions from natural gas use. In total, annual emissions from natural gas, fuel oil, and electricity are very low, just over 11,000 pounds per household. Omaha has far higher emissions from all three sources: nearly 30,000 pounds a year per household. The geographic variation is due, again, to climate-induced differences in household energy use and power plant efficiency.
The economists’ model allows for cities to vary by plant technology and energy demand, and for households to vary by city choice and consumption levels of housing, electricity, natural gas, and fuel oil. Cities in the model also vary in restrictiveness of land-use regulations. The model even includes nuances like a relocation nudge toward an individual’s birth state, a well-known demographic preference.
Policy and emissions
Before using the model to estimate how policy changes might impact emissions and other variables, Colas and Morehouse document the relationship between current land-use restrictions and carbon emissions. As they observe: “Spatial variation in carbon emissions implies that any policy that has an effect on where people live will also impact national carbon emissions.”
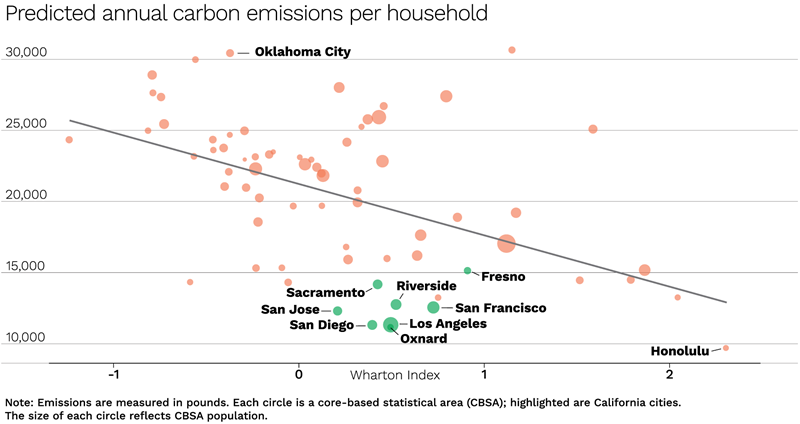
A scatterplot (see figure) of predicted emissions by metropolitan area and the Wharton index of land-use restrictiveness shows a strong negative correlation. Cities with tight land-use regulations have lower per capita carbon emissions. California’s cities (in green) are green because they enjoy temperate climate and efficient power plants, but they also have restrictive land-use policies, inflating housing prices and discouraging people from living there. So the question remains: If these restrictions were eased, where would people live, and what would happen to national emission levels?
Easing restrictions
The economists’ first experiment is hypothetically leveling California land-use restrictions to the Wharton index median. The estimated impact is substantial. In the long run, Americans would go West in droves—a green rush in which California city populations would increase 68 percent through an influx from elsewhere in the West and around the nation: a 13 percent drop in the West, 5 percent in the Northeast, and 7 percent in both the South and the Midwest. National use of natural gas, electricity, and fuel oil would decline by 1.1 percent, 1.7 percent, and 5.6 percent, respectively, as population shifts to temperate climates with efficient power generators. The nation’s carbon emissions would drop by 2.3 percent.
And because California cities have high productivity levels, median income levels nationally would rise by 1 percent (and twice that for skilled workers).
The second hypothetical is to set land-use restrictions in all U.S. cities, not just California’s, to the national median. National migration would be even more dramatic, from the South and Midwest to the West and Northeast. Population in the Northeast would double from its current 18 percent of the national total to 36 percent while dropping substantially in the Midwest and South. California’s cities would increase to about a 12 percent share of the national total from their current 10 percent.
Energy use and carbon emissions? Natural gas use would increase slightly, electricity drop, and fuel oil rise significantly. Emissions would drop by a full 8 percent.
A carbon tax
The third theoretical test is the impact of imposing a carbon tax of $31 per ton, an estimate of the social cost of carbon from Yale economist and Nobel laureate William Nordhaus. A carbon tax can reduce emissions in the economists’ model by encouraging households to consume less energy wherever they currently live and by inducing people to relocate to cities that use less energy due to their temperate climate, efficient power plants, or both.
The magazine of the opportunity & Inclusive Growth institute
Again, the emissions reduction is dramatic, a 12.3 percent decrease in national residential carbon emissions; and, again, population would shift to the West and Northeast from the South and Midwest. Relative to leveling the land-use restrictions, however, the population moves from the carbon tax are quite minor.
Any tax has distributional consequences, so the economists calculate the carbon tax’s incidence on the average household in each region. The household tax burden would fall most heavily on the Midwest ($362) and South ($318) and more lightly on the energy-efficient West ($251) and Northeast ($280.) It would fall harder on households with children, more education, married couples, and minorities. “Overall,” write the economists, “these results suggest that a carbon tax may have significant distribution effects.”
Conclusion
Colas and Morehouse’s exploration of emissions and policy is an important step in designing climate change policy, providing empirical estimates of how easing land-use regulations or imposing carbon taxes would affect carbon emissions, population distribution, income levels, and economic welfare.
Their academic exercise is also highly pragmatic. California’s Legislature voted down a bill that would have relaxed density restrictions and reduced the number of areas zoned only for single-family homes. Its proponents say they’ll continue to push for zoning reform. Though it wasn’t the economists’ intent, the Colas-Morehouse estimates provide solid ground for such efforts.