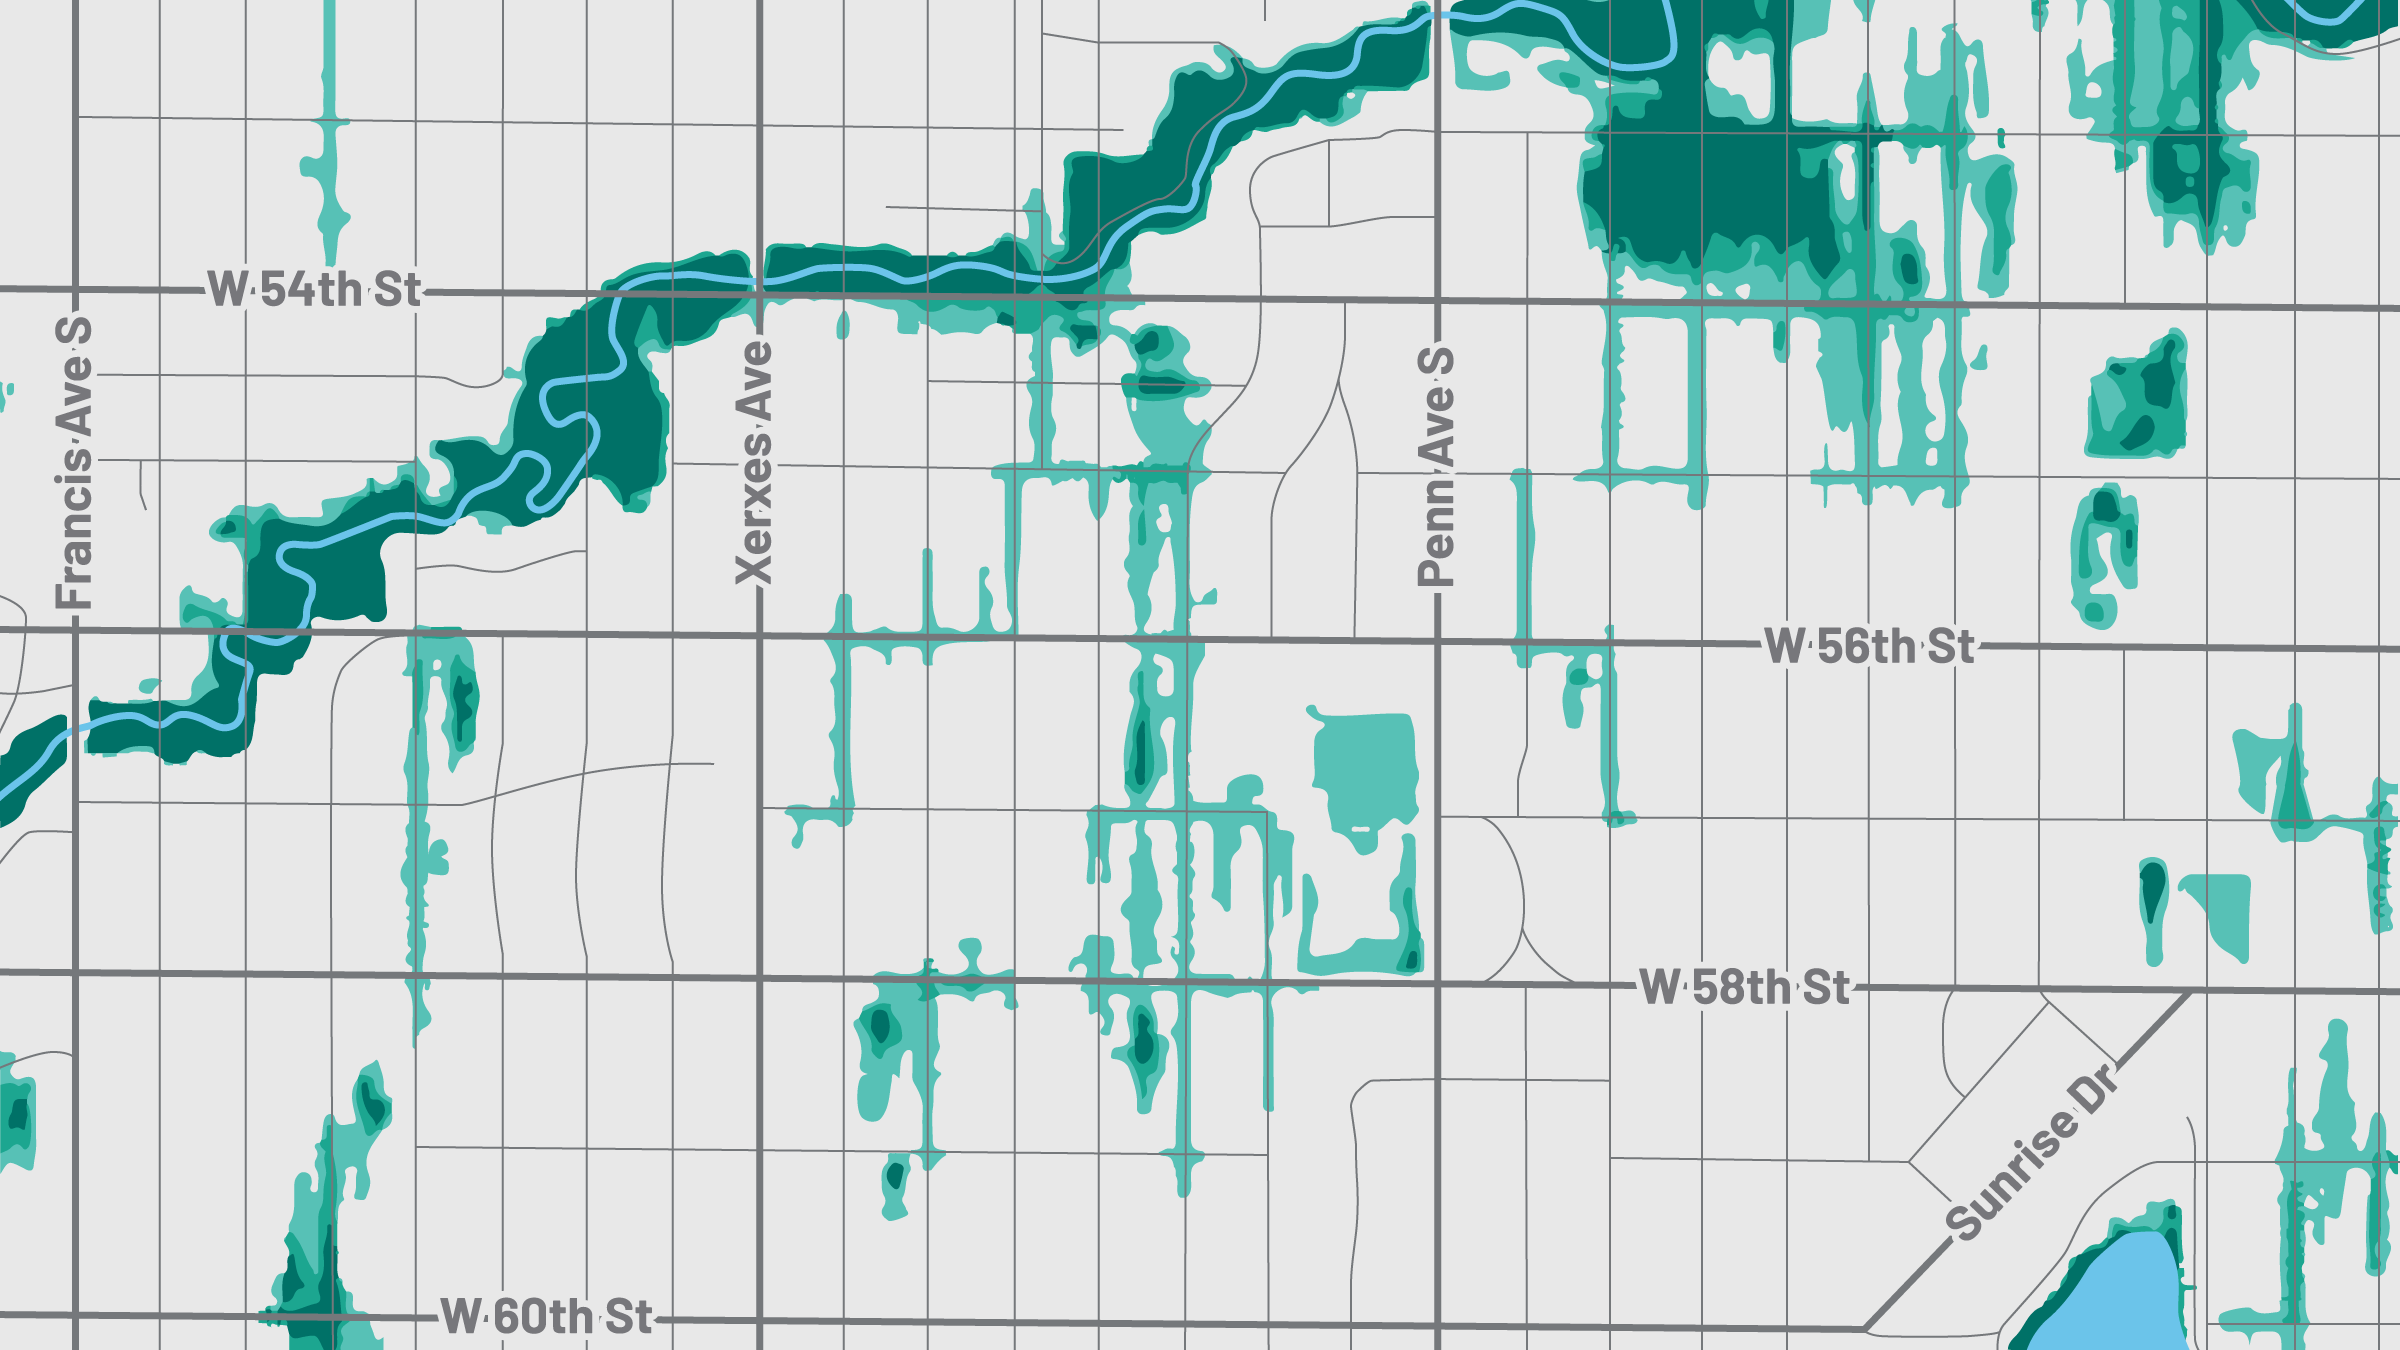
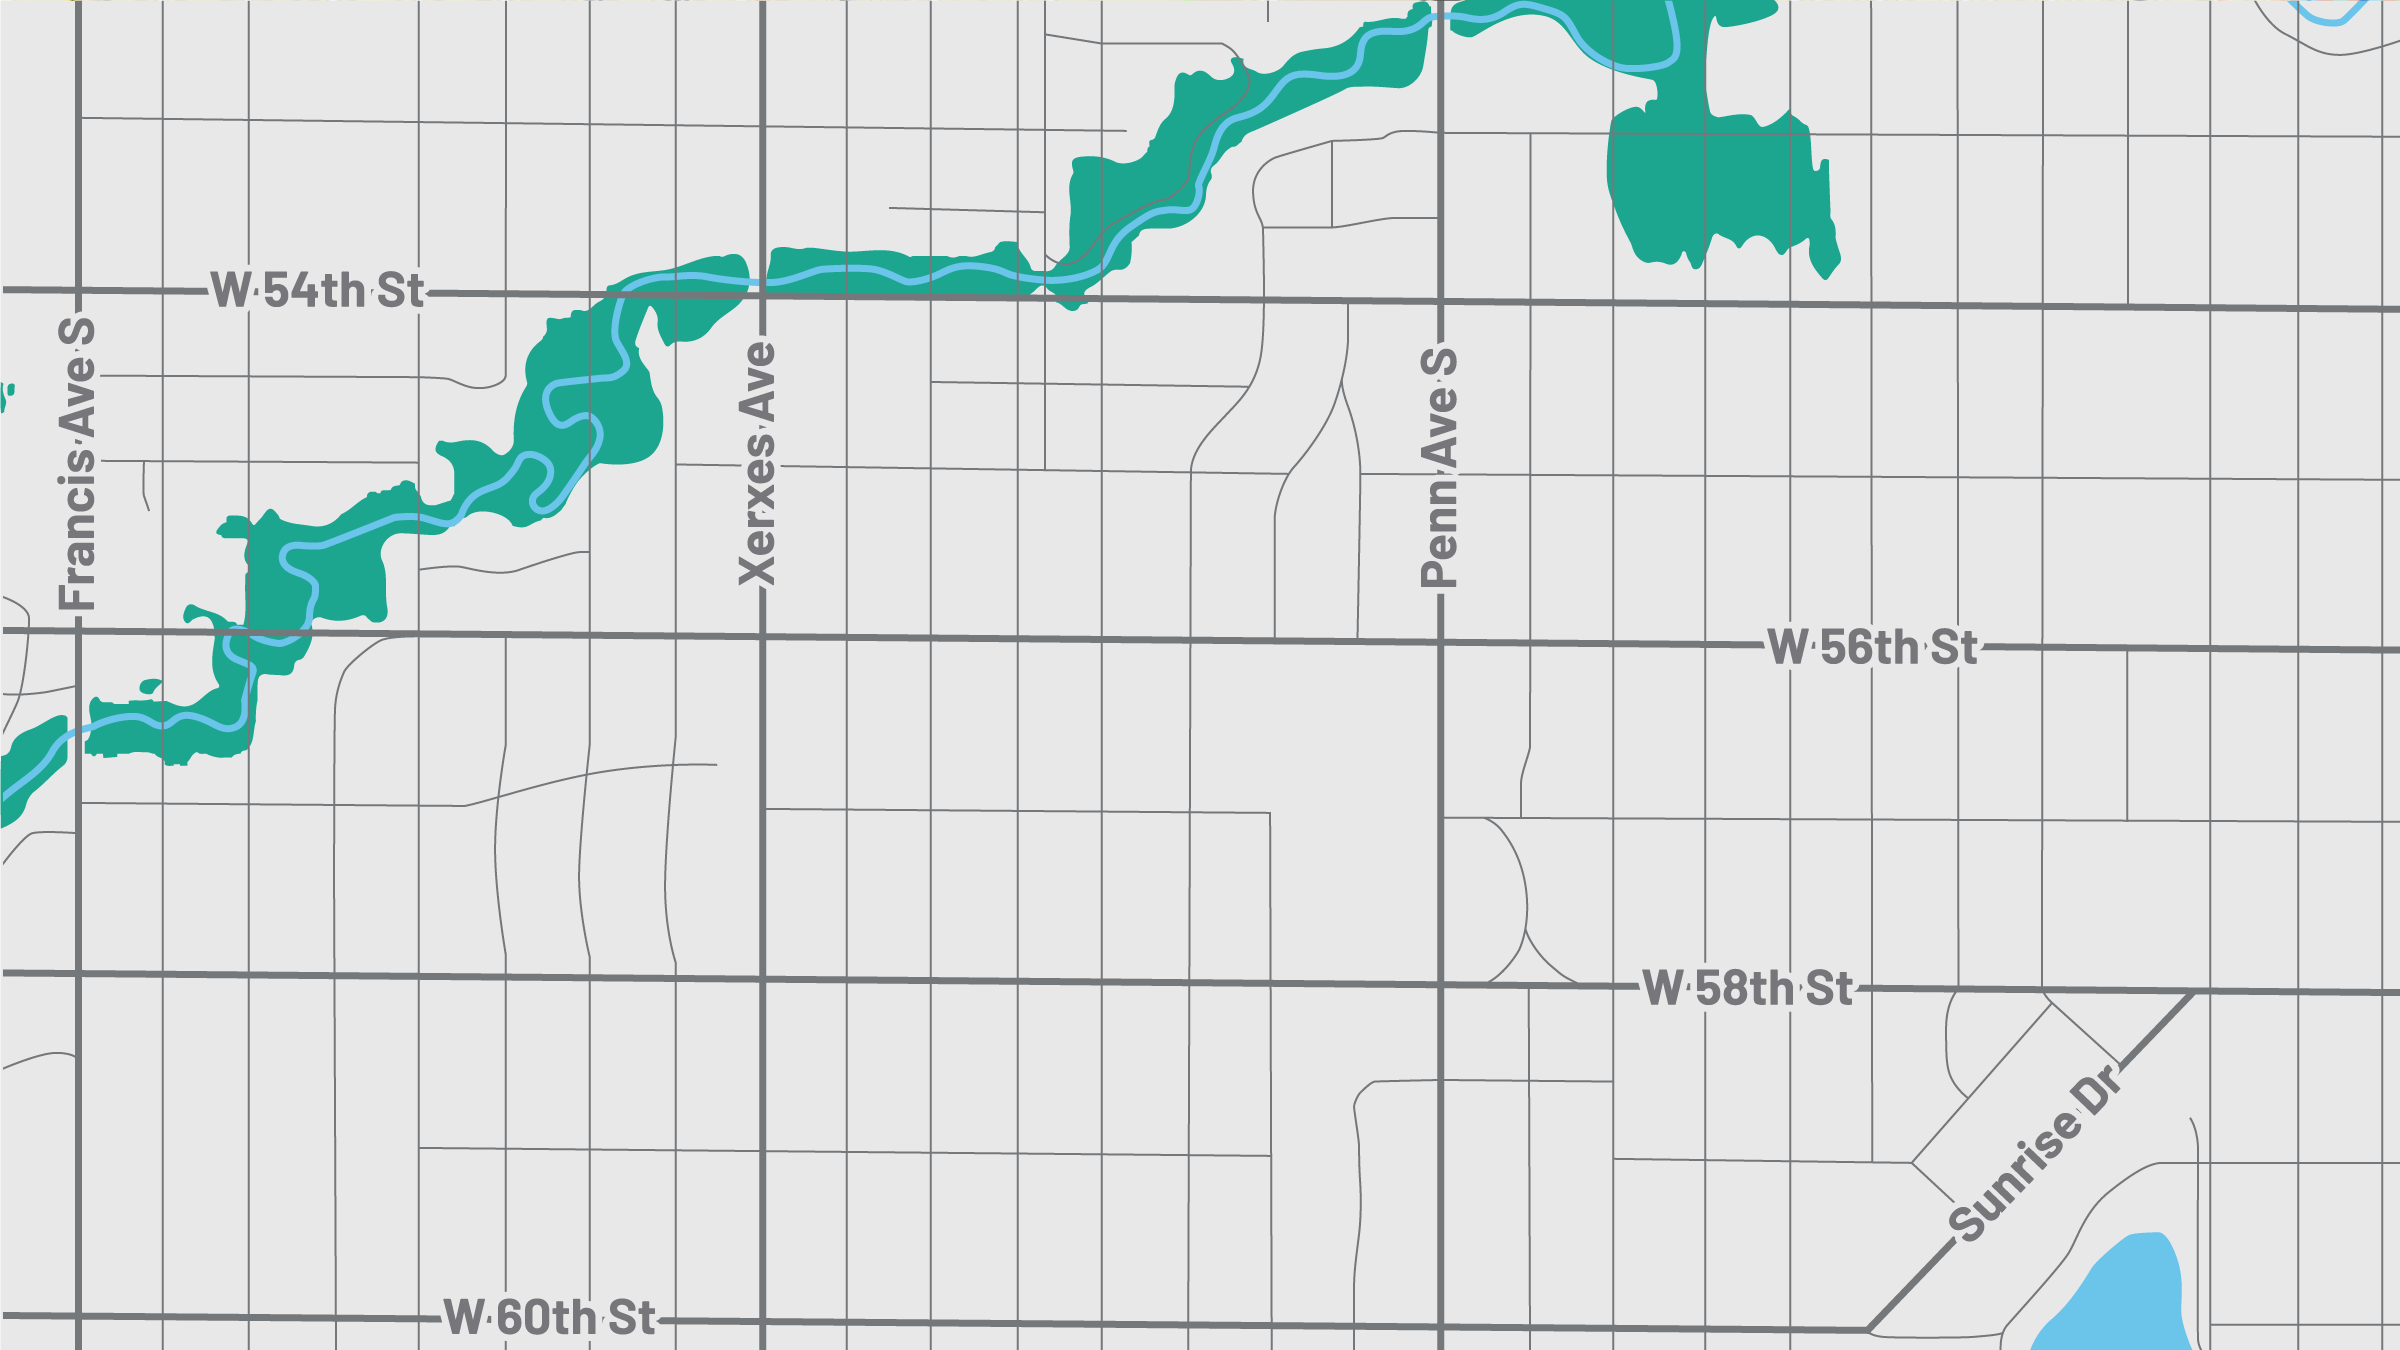
On the Federal Emergency Management Agency’s (FEMA’s) flood map, the house with the “for sale” sign in Minneapolis’ Armatage neighborhood is in an “area of minimal flood hazard.”
It’s on high ground relative to nearby lakes and streams and is almost a mile away from the nearest 100-year floodplain. Properties in the floodplain have a 1 percent chance of being flooded each year, which is a severe enough risk for the government to mandate flood insurance.
But a new privately developed flood map from the First Street Foundation (FSF) shows that the house is actually at “major” risk of flooding. In a 100-year flood, there would be nearly a foot of water on the property.
There are many properties like this house throughout the country where flood risks, or rather the understanding of that risk, is changing.
And the change in risk it depicts is enormous (see accompanying figure below). In Minneapolis, FSF’s maps show 6,195 properties with a 1 percent risk of flooding, 37 times as many as FEMA’s.

FSF flood map

FEMA flood map
Note: This example is located in Southwest Minneapolis
Source: FSF, FEMA
It’s less dramatic across the Ninth District, but FSF shows nearly triple the number of at-risk properties as FEMA (see accompanying chart below). Throughout the United States, it shows almost twice as many properties at risk.
Information deficiency
An accurate understanding of flood risks can drive important decisions, such as how much to pay for a home or whether to buy flood insurance. But, for many years, the only information most of the general public had about flood risks came from FEMA’s flood insurance rate maps, which have many limitations.
Critics have complained that FEMA’s maps don’t include floods caused directly by rainfall and don’t account for climate change; the federal agency uses past flooding to estimate the risk of future flooding. FEMA also doesn’t map many sparsely populated areas, including large expanses of the West and Midwest.
FSF’s maps, developed by a team of scientists and engineers, are meant to address these concerns, and FSF is able to do what FEMA could not, in part, by sacrificing some accuracy. Unlike FEMA, FSF didn’t conduct costly on-the-ground verification of data that may be out of date or imprecise, such as elevation data from aerial surveys.
FEMA said in a statement that, while it hasn’t evaluated FSF’s maps, it believes FEMA’s methodology produces more accurate maps that can be counted on for making decisions regarding public safety. FSF’s maps, it said, are accurate enough to help property owners decide on ways to mitigate their flood risks, such as buying flood insurance.
FSF said its methods have been used for years by for-profit firms to map flood risks for businesses and investors.
Extreme rainstorms
In the Twin Cities and other areas already mapped by FEMA, FSF’s maps make a big difference by showing where rainwater would pool and how deep the pooling could get during a 100-year storm.
In Minneapolis, FEMA’s maps show flooding only in areas near bodies of water, such as Minnehaha Creek. But FSF’s maps show a city dotted with depressions that would turn into ponds or small lakes if rainfall were so severe as to overwhelm local storm sewers.
The Armatage house lies in one of those depressions. Though the property is at least two dozen feet higher than nearby streams and ponds, the area it’s in is rimmed by properties on higher ground. FSF’s analysis suggests that the flood would be high enough to soak first-floor drywall and damage appliances. Presumably, the finished basement would also flood, damaging the furnace and water heater.
Unmapped risks
In many places, FEMA doesn’t provide any flood map at all. Because precise maps are costly and the agency’s funding is limited, FEMA tends to focus scarce resources on areas with many flood-prone structures.
According to the Association of State Floodplain Managers, most of the unmapped areas are in the middle of the country, including vast areas in the Dakotas and Montana.
FSF was able to model flooding in these areas, in part, because it used a nationwide elevation data set that doesn’t meet standards for precision required by FEMA flood maps.
The difference is stark. In 26 South Dakota counties that are mostly unmapped by FEMA but were mapped by FSF, the foundation counted 18,486 properties with at least a 1 percent risk of flooding. FEMA, which mapped some larger towns in these counties, counted 575 properties at risk (Table 1).
| MN | MT | ND | SD | WI (9th Dist) | MI (9th Dist) | |
|---|---|---|---|---|---|---|
| FEMA | 70 | 688 | 796 | 575 | – | 867 |
| FSF | 21,132 | 14,162 | 11,518 | 18,486 | – | 4,370 |
Climate change
The number of properties at risk is expected to grow over the next 30 years as our climate continues to change, according to FSF models, which use NASA climate projections.
In the Ninth District, that’s an increase of 12,454 at-risk properties.
But the impact would vary greatly from place to place. The western two-thirds of Montana would be hit three times as hard as the rest of the district, mostly because of more extreme rainstorms throughout the western United States (Table 2).
| 2020 | 2050 | 2020–2050 % change | |
|---|---|---|---|
| Ninth District | 558,327 | 570,781 | 2.2% |
| Western half of Montana | 104,883 | 110,214 | 5.1% |
| Ninth District excluding western Montana | 453,444 | 460,567 | 1.6% |
| United States | 14,609,679 | 16,196,752 | 10.9% |
| Coastal counties | 4,689,000 | 5,827,039 | 24.3% |
| U.S. excluding coastal counties | 9,920,679 | 10,369,713 | 4.5% |
Behavior change
The big question, though, is: Will this new information about flood risks prompt more property owners to buy flood insurance or invest in some other mitigation measures? FSF seems to think so.
Though its maps don’t carry the weight of federal regulations, it could affect the housing market. In August, Realtor.com began linking real estate listings with the maps, which both FSF and the website said would help homeowners make decisions about protecting their property.
For houses not on the market, it may take more than a map.
As behavioral science has found, people don’t have a good grasp of low-probability risks. Even within FEMA 100-year floodplains, properties that aren’t mortgaged and therefore can’t be required by the government to have insurance often don’t. Insurance purchases often go up after big floods, only to go down again as time passes.
Tu-Uyen Tran is the senior writer in the Minneapolis Fed’s Public Affairs department. He specializes in deeply reported, data-driven articles. Before joining the Bank in 2018, Tu-Uyen was an editor and reporter in Fargo, Grand Forks, and Seattle.


