Author

Article Highlights
- Since March 2020, economists have improved early pandemic forecasting models, but have been unsuccessful in integrating human behavior
- A new model, featuring lagged behavioral response, seasonal fluctuation, and new variants, matches U.S. and U.K. data well, and forecasts sharp disease surges in both nations
- According to the model forecast, the U.S. is engaged in a race between vaccination and the variant
Of the innumerable factors shaping the course of the coronavirus pandemic, one of the most important is human behavior. It is also arguably the most difficult to predict. People’s reactions to the disease and measures to contain it range widely and change frequently, influenced by individual temperament, information, and experience.
Will people wear masks? Will they avoid vaccination? How will governors balance pressure from businesses that want to remain open against calls for shutdowns from public health advocates? For how long, and to what degree, will people be willing to socially distance themselves to protect against contagion?
These and other personal concerns are critical determinants of viral spread. To date, however, model simulations that incorporate human behavior have been largely unsuccessful.
But a new paper by Minneapolis Fed consultant Andrew Atkeson of UCLA holds considerable hope. With colleagues Karen Kopecky and Tao Zha, Atkeson has designed a model that includes a proxy for “pandemic fatigue”—the all-too-familiar boredom and disquiet that follows weeks and months of pandemic stress and inactivity—and the relaxation of safeguards that accompanies fatigue.
Two other key features of the model are pandemic seasonality and coronavirus variants. The former are the peaks and troughs in infection that occur during winter and summer, respectively, as people shift activity indoors and out. The variants, of course, are the newly emergent, highly infectious mutations of the coronavirus.
To this behavioral model, Atkeson then adds one more element: an imperfection in human behavior, a response lag that allows the model to better match reality.
Atkeson’s model simulations for the United States and the United Kingdom from the pandemic’s February 2020 start to the present achieve remarkable matches with actual data of disease and death rates for both countries. All three factors, plus the time lag, play crucial roles: Omit any, and the model fails at one stage or later. The paper also forecasts the course of the pandemic until a predicted end early in 2023, indicating large loss of life and illustrating the urgency of vaccination campaigns.
“The results indicate that a successfully executed vaccination program could potentially save a large number of lives in both countries,” writes Atkeson, “roughly half a million in the United States and one hundred thousand or more in the United Kingdom.”
Atkeson arrives at this conclusion in his most recent staff report (SR 619) for the Minneapolis Fed. This follows nearly a year of research on the COVID-19 pandemic. Since March 2020, he has published six staff reports on the topic, plus a Quarterly Review article. This digest describes his path of inquiry from the first paper to the most recent.
Failure of the standard model
Epidemiologists have modeled pandemics mathematically for nearly a century, using what’s referred to as an SIR model—S for susceptible people, I for the infected, and R for the recovered (or dead). More recently, scholars added E: those who have been exposed to the virus but aren’t yet infectious. For COVID-19, it is estimated that it takes a few days after exposure to the virus before one can infect others.
This SEIR model assumes that, in the face of an emergent disease, people do not change their behavior. The result is exponential growth in infections and deaths until the disease runs out of people to infect. This standard model has been very successful as a conceptual framework and underlies a wide range of epidemiological models in use today. It works well for animals, which do not respond behaviorally to pandemics. But, as Atkeson soon found with COVID-19, it consistently overpredicts the speed and initial severity of human pandemics.
In staff report 595, published in mid-March 2020, Atkeson used a standard SEIR model with no behavioral response to sketch scenarios for the evolution of the COVID-19 pandemic. The model predicted that COVID-19 would sweep quickly through the population, with infections and deaths peaking at very high levels as a fraction of the population. In a year or less, the model forecast, the pandemic would exhaust itself, like a fire running out of fuel. Clearly—and fortunately—nothing of the sort has happened. Instead, we found ourselves mired in a long slog with this disease.
Searching for answers
In an August 2020 staff report (SR 611), with Kopecky and Zha, Atkeson analyzed the pandemic’s international evolution for clues as to why forecasts from the standard model didn’t match the data. The economists found a striking pattern in nearly every country: The growth of deaths fell rapidly in the first month or so of the pandemic, well before the virus had run out of new people to infect. The standard model failed to explain this nearly universal phenomenon.
Atkeson and his co-authors considered three hypotheses that might account for this regularity:
The slowdown might be due to some purely natural force. Epidemiologists have long noted that influenza pandemics speed up and slow down for reasons not fully understood—the Spanish flu of 1918-19, for example, is famous for having come in three waves with no obvious seasonal pattern.1 Moreover, it struck in different regions with different intensities with seemingly no rhyme or reason. Perhaps the slowdown of the COVID-19 pandemic was simply the result of natural forces not yet known.
A second hypothesis: Perhaps the slowdown is due to the network structure of human interactions. The idea is that the people with many socioeconomic connections get sick quickly in the pandemic’s first stage; transmission then declines as the virus looks for those whose networks require less face-to-face interaction. According to this hypothesis, the progress of the pandemic would slow naturally even without a change in individual behavior. See staff report 609 by Azzimonte, Fogli, Perri, and Ponder for exposition of a theory of social networks and virus transmission.
A third possibility: Was the slowdown of the pandemic due to government-mandated lockdowns? Certainly, these played some part in curbing the spread of the virus. But these mandates seem unlikely to be the primary cause given that the slowing of the disease appeared across a wide range of countries, irrespective of policy. A rapidly growing body of evidence documents that social distancing patterns were similar in regions with different policies, suggesting that people were looking to avoid the disease regardless of government lockdowns.
In addition to the still-unexplained slowdown, scholars have noted another nearly universal pandemic pattern. Since the summer of 2020, the growth rate of daily deaths has stayed in a narrow range around zero—plus or minus 5 percentage points—even as seasons changed and government mandates were lifted. This has been observed almost everywhere in the world.
While this range in growth rates is wide enough to account for the peaks and troughs of daily deaths seen globally, it is much smaller than a standard SEIR model would predict for death rate growth after government mandates are lifted. Atkeson’s staff report 595, for example, using a standard SEIR model to forecast trends if severe mandates are imposed and then lifted, estimated that infections would soar when lockdowns were lifted to the point that over 20 percent of the population (70+ million Americans) were actively infected at the same time (see Figure 12 in SR 595). Fortunately, nothing like this has happened anywhere in the world, except perhaps in the city of Manaus in northwestern Brazil.
Accounting for human behavior
It seems instead that some sort of mechanism keeps the disease from speeding up or slowing down beyond a narrow range. The puzzle is that the levels of daily cases and deaths from COVID-19 in any region or country rise and fall in waves, but the peaks are not as high, nor the troughs as low, as predicted by the standard epidemiological model.
In staff report 618, Atkeson, Kopecky, and Zha seek a solution by adding a simple behavioral response mechanism to a standard SEIR model. In this augmented SEIR, humans respond to their perceptions of the pandemic by taking more or fewer safeguards against catching the virus. The economists estimate their parameters about how humans react to disease by using data from the pandemic’s early phase, when disease growth slowed dramatically in the face of rapidly rising deaths.
This augmented model, they find, can reproduce the early slowdown in the growth rate of the pandemic quite well; it’s something of an empirical success. However, they point out, the model cannot successfully reproduce the observed surges of cases and deaths seen in many locations since May.
Instead, the predicted size of the waves is much too small. The estimated response of human behavior to the incidence of disease is too swift and too strong. That is, the model predicts that a small rise or fall in the level of daily deaths would provoke such a strong reaction that the pandemic would have no room to either grow or shrink. Ironically, this is the exact opposite of the excessively large waves predicted by a simple SEIR model without human behavior.
What, then, regulates the speed with which the COVID-19 pandemic makes its way through the population? What limits the size of the pandemic’s waves in either direction? Without answers, it will be virtually impossible to make accurate forecasts or to truly understand the impact of new virus variants, of masks, of vaccination programs, and of lockdowns, testing, and other policies that might alter the course of the pandemic.
Imperfect reactions
In staff report 619, Atkeson experiments with a “flawed” behavioral response mechanism. Perhaps a lag in reaction time slows the behavioral response, preventing the nearly instantaneous changes predicted by the augmented SEIR model in staff report 618. Like a thermostat, whose ability to change a home’s temperature is somewhat delayed and imprecise, human reactions to pandemic events are lagged and imperfect, in part because people are responding to delayed news and noisy information.
The idea is that if people react—by relaxing or tightening precautions—to reports of daily deaths, and those death reports are delayed and approximate signals of what is actually happening with infections, then the model might allow room for the growth rate of disease to fluctuate in a properly sized band around zero. The range will be neither too narrow (as with the simple behavioral SEIR model) nor too wide (as with a standard SEIR model lacking behavioral response). In essence, the imperfection in the human thermostat is that it is reacting to old news, and that allows for behavioral response that’s slightly muted.
Why the delay? In the real world of health care systems, government bureaucracies, and media, there is significant lag between event and awareness, particularly with public health data. Hospitalization, recording of death, compilation of data, confirmation by authorities, public reporting all take time.2
To implement this “flaw,” Atkeson adds a new compartment to the augmented SEIR: H for patients hospitalized with COVID-19. This new stage inserts the time delay, an estimated 30 days from symptom onset to death to reporting of death. So, while individuals and policymakers intend to react to the current status of contagion, they don’t see actual infections; instead, they see deaths and hospitalizations, signals of disease transmission and infection that occurred in the past. H provides that mathematical interval between infection and public awareness of subsequent death.
SEIR with delayed human response
Equipped with an SEIR model in which the response of behavior to changes in the speed of disease transmission is imperfect, Atkeson then focuses on three specific shocks that might account for the actual waves of daily fatality in the United States and the United Kingdom.
The first shock is natural seasonal variation in the speed of transmission of the virus. Contagion is highest in the winter—as people move indoors—and lowest in midsummer, when activity has shifted to porches, lawns, and parks. While it isn’t certain how important seasonality in transmission is for COVID-19, evidence from seasonal influenza and now a year of data from both the Northern and Southern hemispheres suggest that seasonal variation may well be an important driving force.
The second shock is pandemic fatigue. Frightened by the unknowns at the start of this pandemic, many chose to shelter in place even in the absence of government mandates. But after gaining clearer understanding of risks and growing weary of isolation, many have since relaxed precautions. Even with record-high levels of daily deaths this winter in both the U.S. and the U.K., people are still going out much more than in March and early April. Clearly, the behavioral response driven by fear of the disease is not as strong as it was in the pandemic’s first months.
And, for the third shock, the model includes for the United Kingdom, as of Sept. 1, 2020, a more contagious mutation that eventually supplants the original. Holding fixed the influence of seasonality and behavior, the new variant is estimated to be 38 percent more transmissible. This new variant now accounts for the overwhelming majority of new U.K. infections. It arrived in the United States by December 2020, where it is forecast to accelerate the disease in the spring as it becomes the dominant strain in circulation.
Variations on a theme
Atkeson finds that the model modified to include this delay between infections and deaths accounts remarkably well for the patterns of daily deaths in the U.S. and the U.K. over the past year. (See Figures 1 and 2.) He then uses the model to assess the role of these three shocks in accounting for the data by running multiple variations of the model, switching features off and on to gauge their individual and joint impacts.
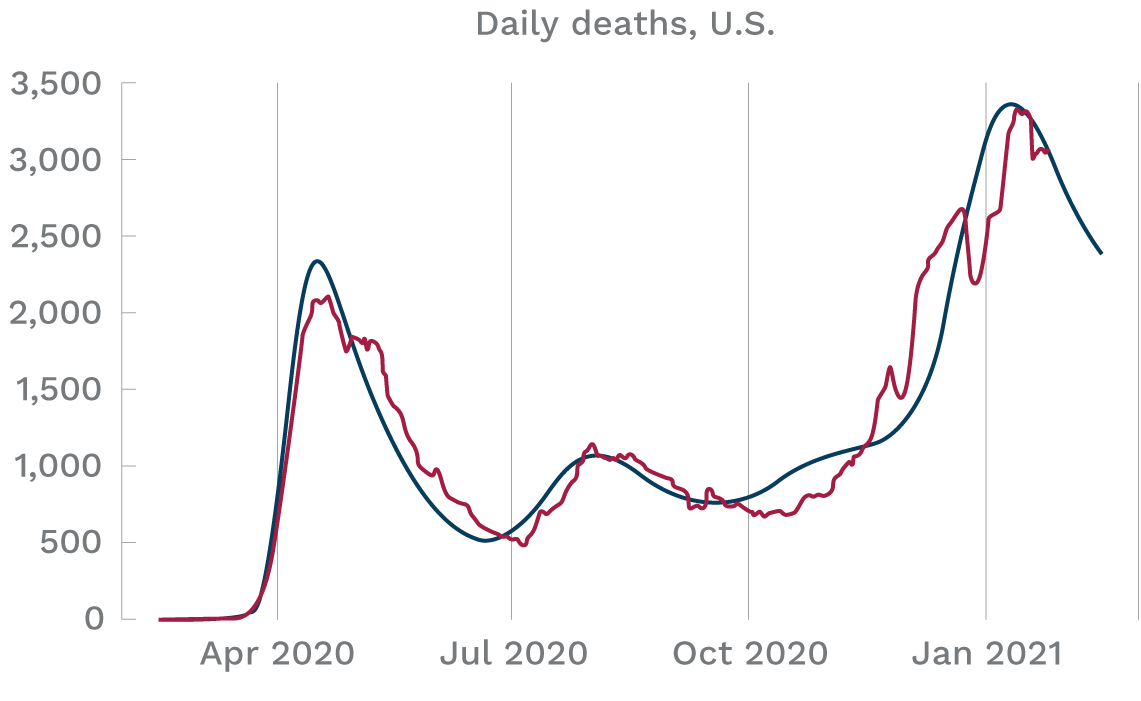

Source: A. Atkeson, Staff Report 619, Federal Reserve Bank of Minneapolis
Seasonality, he finds, is key to the decline in daily deaths observed in both countries in the spring of 2020 to lows by summer. The model fits the data in both countries through the summer of 2020 quite well with the parameters of the behavioral response held fixed. That is, according to the model, we can understand the evolution of the pandemic through the summer simply as a result of a constant responsiveness of behavior to the level of daily deaths, with seasonality helping to drive down the first wave of deaths to summer lows.
But, surprisingly, the fall-winter seasonal effect of increased contagion as people move indoors is not sufficient to generate the large subsequent waves of fatality in both countries. Even the arrival of the new, more contagious variant of the virus in the U.K., combined with fall-winter seasonality, does not generate the large waves of deaths later in the year experienced there.
To accurately replicate the surge in deaths experienced in both the U.S. and the U.K. in the fall and winter of 2020, Atkeson finds, pandemic fatigue must be added to the model. Lulled by the summer’s relative peace, it appears, people remained less cautious even as they moved indoors, spurring viral transmission.
Ultimately, then, all three factors—seasonal variation, a lagged behavioral response, and a new virus variant—play crucial parts in the timing and size of the pandemic’s swath through the human population.
And the future?
Atkeson’s last major simulation is a three-year forecast, from Feb. 15, 2020, to Feb. 15, 2023, at which point he projects herd immunity through infection or vaccination. The key elements remain—seasonality, fatigue, and a more transmissible variant. The latter is introduced to the United States three months after its U.K. appearance. Vaccination is consciously not part of the exercise. “These forecasts might then be considered a baseline,” Atkeson writes, “against which progress on vaccines and/or improvements in policy might be evaluated.”
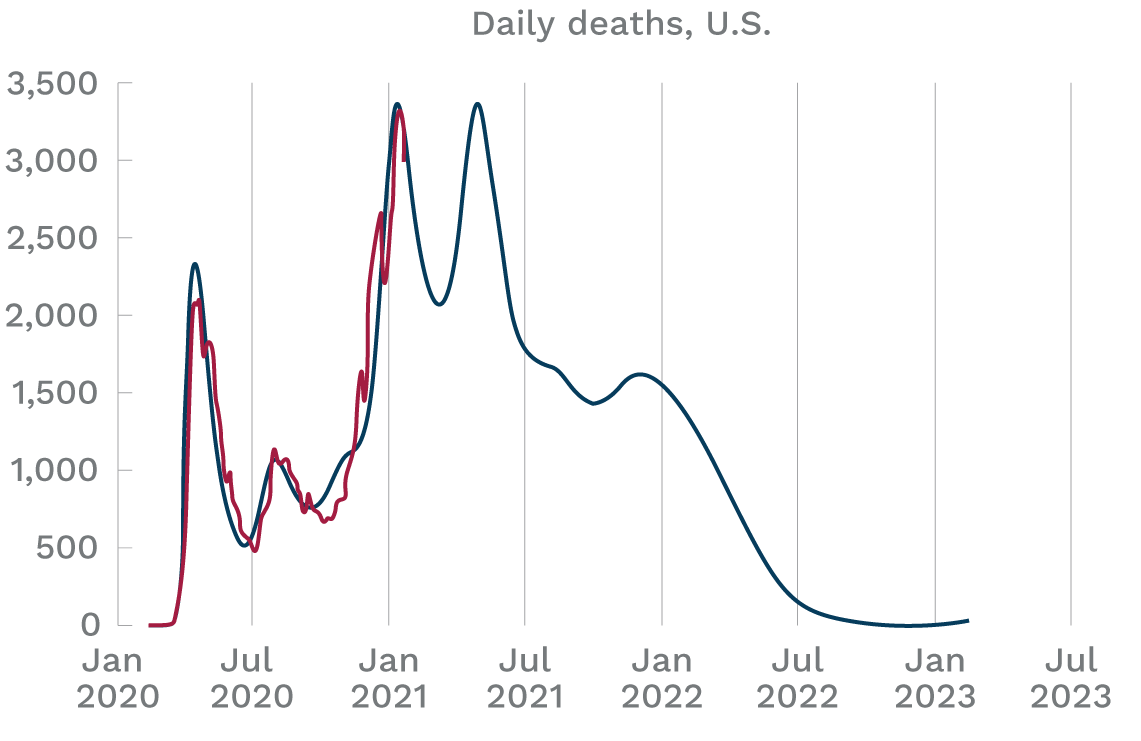

Source: A. Atkeson, Staff Report 619, Federal Reserve Bank of Minneapolis
The U.S. simulation (Figure 3) shows a significant decrease in daily deaths early in 2021, followed immediately by a sharp surge—a third wave—in late spring. The surge is, not surprisingly, driven by the new variant, predicted to account for all infections by summer. The model forecasts that if Americans continue with their more relaxed response to the disease, the new variant will quickly spread and, by late spring 2021, drive the levels of daily deaths back up to the peak levels of early 2021, even with the benefit of a seasonal decline in transmissibility.
Thus, according to the model forecast, the U.S. is engaged in a race between vaccination and the variant. Without a successful vaccination effort, the nation will suffer as many new COVID-19 infections over the next six months as in all of 2020.3
By late 2022, the model forecasts, the disease will fall to very low levels. Cumulative U.S. deaths: 1.25 million, with over 75 percent of the population having been infected.
The United Kingdom, (Figure 4) according to the model, will experience a third wave of fatalities in late 2021 and early 2022, after enjoying a strong decline throughout the year. But by autumn, the illness should be gone. By that point, the model estimates, slightly over 240,000 people will have died of COVID-19 in the U.K.
Further thoughts
Despite the model’s facility in simulating actual disease patterns, Atkeson mentions several limitations, concerns, and research gaps.
A model that included other forces, rather than pandemic fatigue, might be equally successful, he observes. Also, his model and its forecasts omit many important features of the actual pandemic, most notably its geographic and demographic variation. In addition, he notes, the model’s parameters were selected through trial and error, rather than more rigorous identification.
Furthermore, the relative simplicity of the model’s version of behavioral response doesn’t explain whether human activity changes because of government mandates or individual choices. In this and elsewhere in his extensive pandemic research, Atkeson stresses that nonpharmaceutical interventions enacted by governments—business shutdowns, mask mandates, and the like—are a significant and effective part of human behavioral response.
He also spotlights a puzzle that others have observed. Cell phone mobility data don’t parallel trends in individual activity predicted by the model’s pandemic fatigue. Does this reflect a problem with the model or with cell phones as an indicator? Another intriguing issue: The model’s assumed onset of pandemic fatigue occurs at about the same time that two successful vaccines were announced. “Perhaps the news of vaccines led to subtle changes in individual behavior,” he observes.
As these concerns suggest, much remains unresolved. “I see this modeling exercise as a proof of concept,” writes Atkeson. These are important questions, he foresees, “for future research.”
Endnotes
1 See this discussion of eight previous pandemics on page 5 in the April 2020 CIDRAP Viewpoint.
2 The Centers for Disease Control and Prevention (CDC) estimates two weeks as the median period of hospitalization for patients admitted to an ICU and a median of 21 days between death and reporting of the death.
3 The model implies that about 25 percent of Americans had gotten the virus as of the end of 2020. This is consistent with the CDC’s estimate that about 83 million Americans got COVID-19 in 2020. See the CDC’s Estimated Disease Burden of COVID-19. The model forecasts that this fraction will rise to over 50 percent of the population by July 2021 absent vaccines.
Related Content


Related Content
