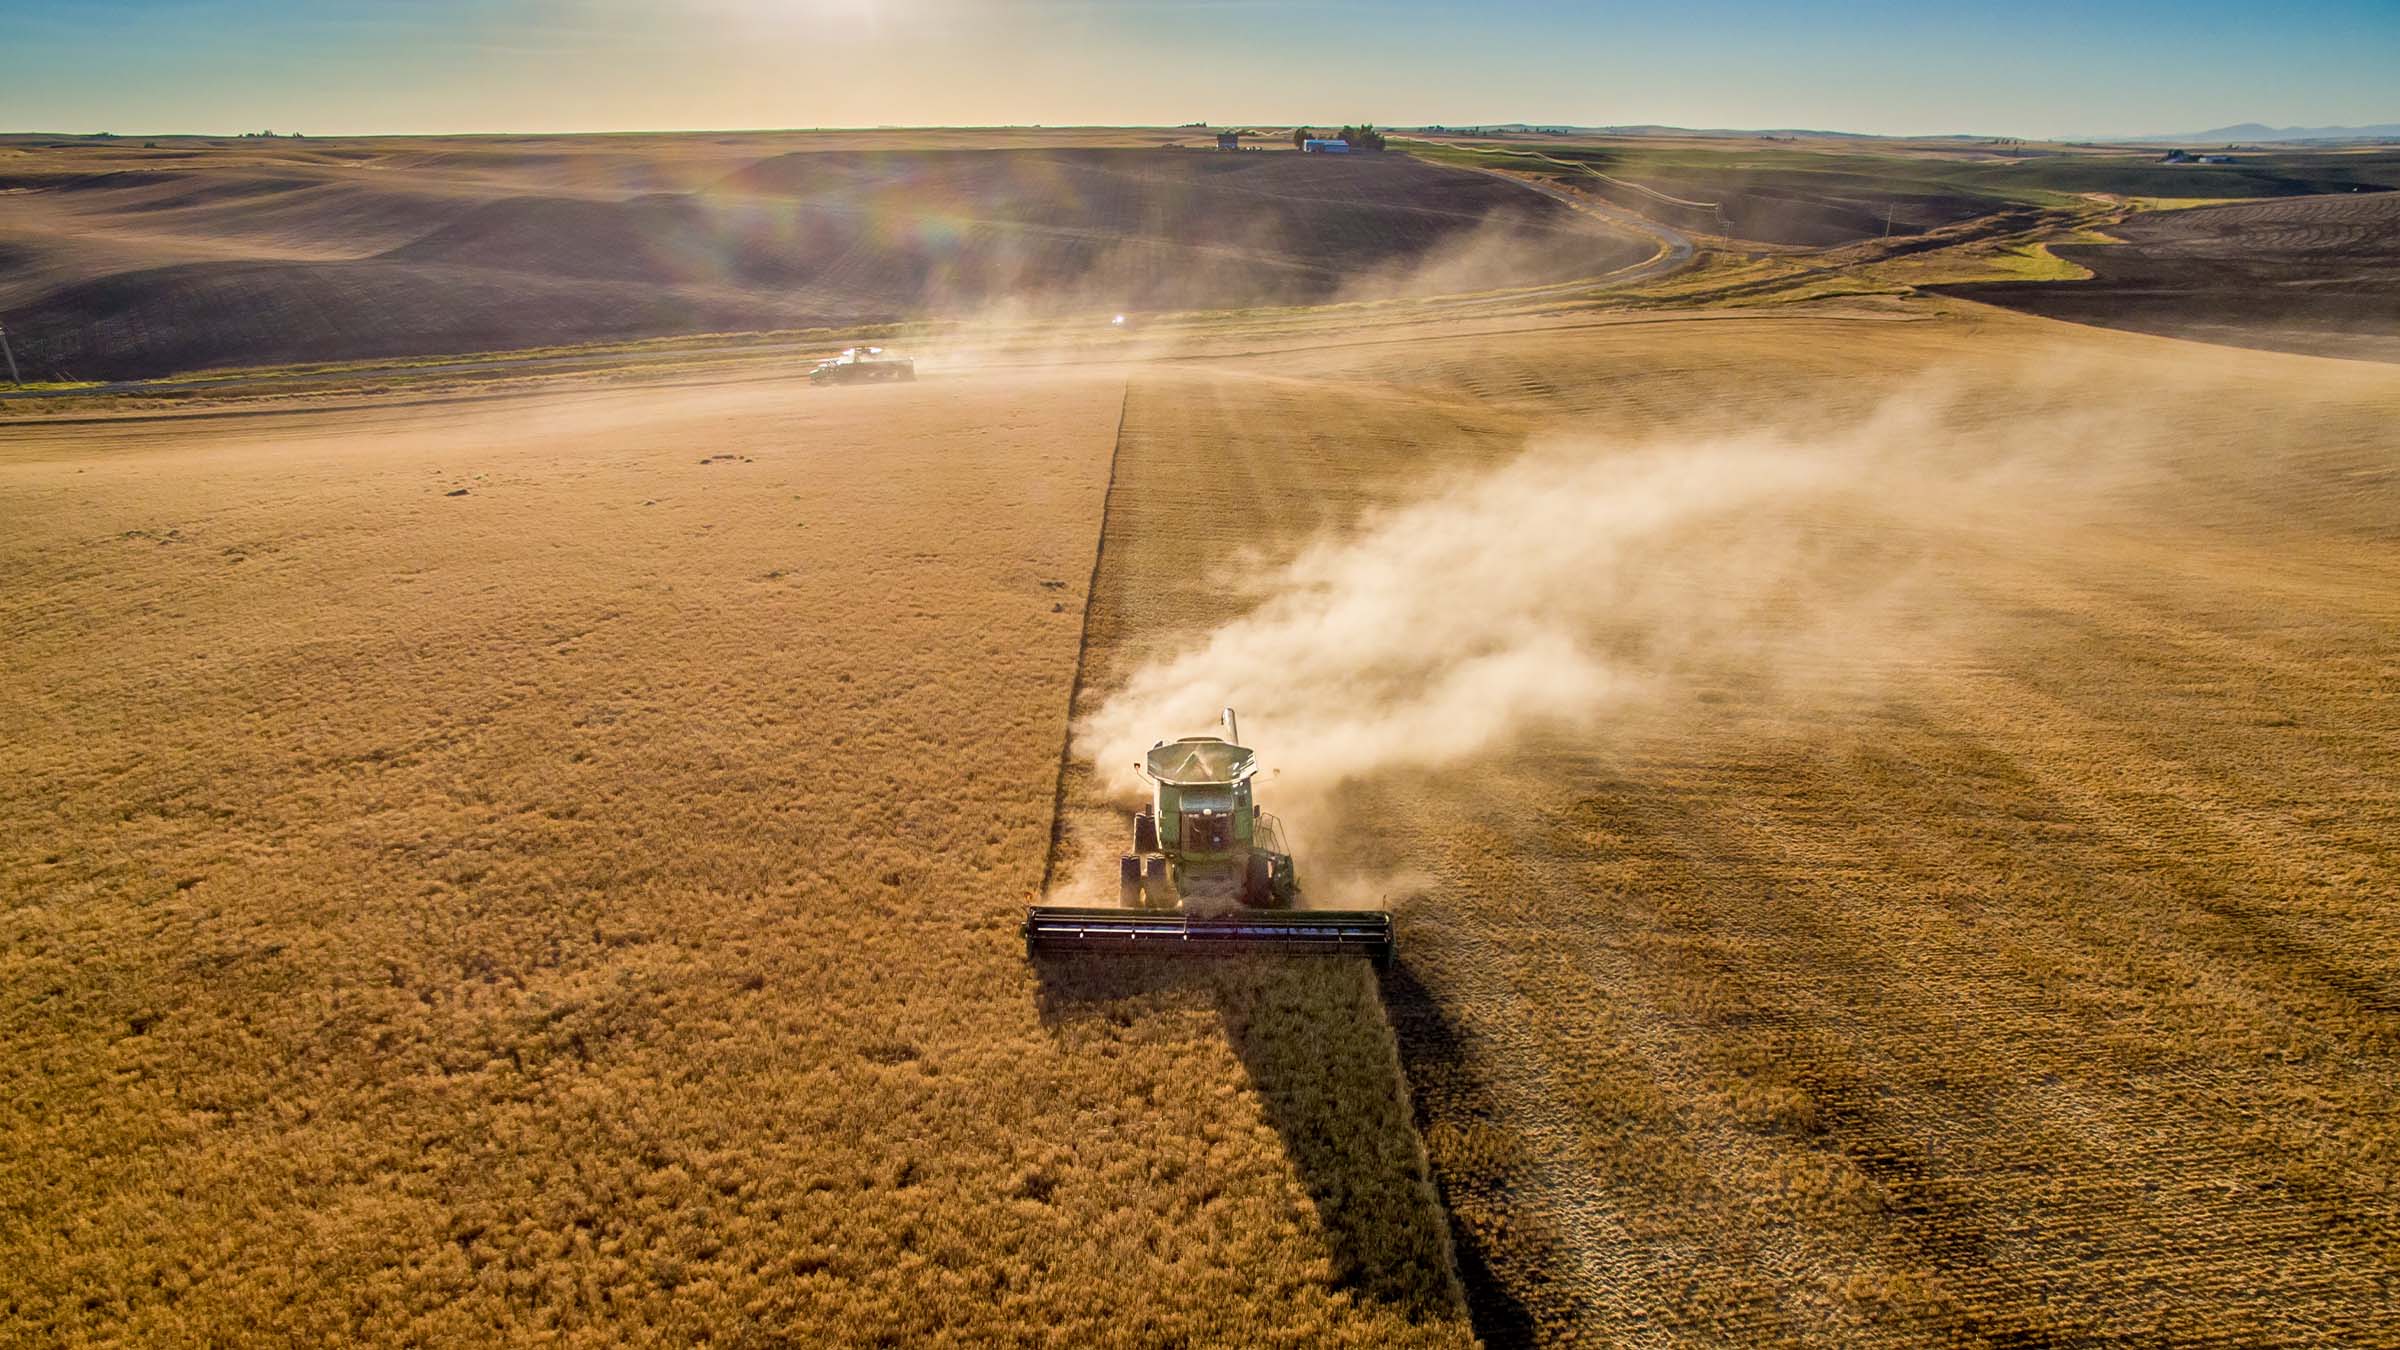
A challenging farm economy creates repayment risks for the least-profitable agricultural producers as their loans reprice.1 Interest rates have increased, resulting in higher payments on farmland loans. In addition, producers are experiencing a decline in farm income as commodity prices retreat from multiyear highs. As annual debt payments rise and farm income declines, debt repayment capacity will erode significantly.
Loan repricing with rising annual debt payments
Loan repricing occurs when a borrower’s interest rate resets due to loan maturity or parameters in a loan agreement. For many years, low and stable rates meant that farmland loan repricing did not materially impact the new payment. Now, as loans reprice in an elevated interest rate environment, borrowers are seeing their payments increase significantly.
Figure 1 illustrates a farmland loan repricing in a stable interest rate environment compared with the current elevated market. The loan amount at loan renewal is the same, but the new annual payment for the farmland loan at the elevated interest rate is 43 percent higher, or about $13,000 more a year, compared with the relatively stable interest rate scenario.
|
1
Loan repricing with stable versus elevated interest rates
|
||||||||||||||||||||||||||||
Lower commodity prices, eroding farm income
Adding to the strain of elevated interest rates, commodity prices are dropping to multiyear lows. With these decreases, the overall ag economy and farm income outlook continue to weaken. Ag producers always expect and experience variable farm income. But large declines in farm income can quickly pressure cash flow and impair debt repayment capacity. As commodity prices retreat from their highs, ag producers need to adjust expenses and update cash-flow projections.
Figure 2 includes commodity price data from January 2020 through September 2024. The figure illustrates the rise and decline of commodity prices for the three major commodities grown in the district: wheat, corn, and soybeans. After peaking in 2022, commodity prices have been retreating for two years and are quickly approaching 2020 price levels. The USDA projects plentiful supply and lower exports of these three crops, resulting in a negative outlook for prices. The low prices and negative outlook indicate that early season cash-flow projections are outdated. Updated projections will help producers, especially the least profitable, understand how their cash flow and repayment capacity change in a challenging ag economy.
Weakening debt repayment capacity for least-profitable producers
The least-profitable producers with repricing farmland loans will experience the most difficulty paying off their debts in 2024. This ultimately makes 2025 loan renewals more challenging. At the end of 2023, the least-profitable ag producers had already experienced notable declines in repayment capacity. They also had a negative debt coverage ratio.2 Figure 3 shows the debt coverage ratio for least- and most-profitable producers from 2011 to 2023. The figure shows the two most recent periods of elevated farm income, the early 2010s and 2020s.
Farm sector debt repayment capacity weakened considerably in 2023. For the most-profitable producers, the debt coverage ratio declined more than twofold. But these producers still generated enough profit to service debt (a ratio above 1.0). For the least-profitable producers, the debt coverage ratio turned negative. These producers were unable to meet current interest expenses and term debt payments. To cover debt obligations, they likely used open accounts, secured additional financing by leveraging existing equity, or liquidated assets.
Figure 3 highlights the effects of sudden drops in farm income after the high-profit years of 2012 and 2022. When farm income declined sharply in 2013, the debt coverage ratios for the least-profitable producers turned negative and remained negative for three more years. The debt coverage ratio for the least-profitable producers did not noticeably improve until 2020. We saw a similar scenario begin to unfold in 2023, with a sharp decline in farm income and a negative outlook on the farm economy emerging in 2024.
Challenging times ahead
In this elevated-rate environment, ag borrowers will see higher interest payments for repricing farmland loans, which will increase their repayment risk. Declining farm income magnifies these risks. The least-profitable ag producers have especially heightened repayment risks because of weak farm income and higher levels of debt—even during years with higher income.
Using recent history as a guide, the least-profitable ag producers will experience challenging times ahead, and lenders should plan accordingly.
Endnotes
1 This group includes the bottom 20 percent of producers in the FINBIN database as measured by net farm income. The University of Minnesota’s FINBIN database includes financial information for over 3,000 farms throughout the Upper Midwest.
2 Debt coverage ratio is the measure of an ag borrower’s ability to make debt payments. It indicates whether the producer generated enough income to cover current interest expenses and all intermediate and loan-term debt payments. According to the Farm Financial Scorecard, a strong debt coverage ratio (above 1.75) indicates that there are enough operational funds to make debt payments. A weak ratio (below 1.25) indicates that an ag borrower is in a vulnerable repayment capacity position and may not be able to pay off debts. The ag borrower may need to liquidate assets or obtain additional funding from a lender.


