In June, the U.S. unemployment rate was 4.1 percent. But that rate isn’t constant across every local job market—in Bakersfield, California, the rate was twice as high. In Portsmouth, New Hampshire, it was half.
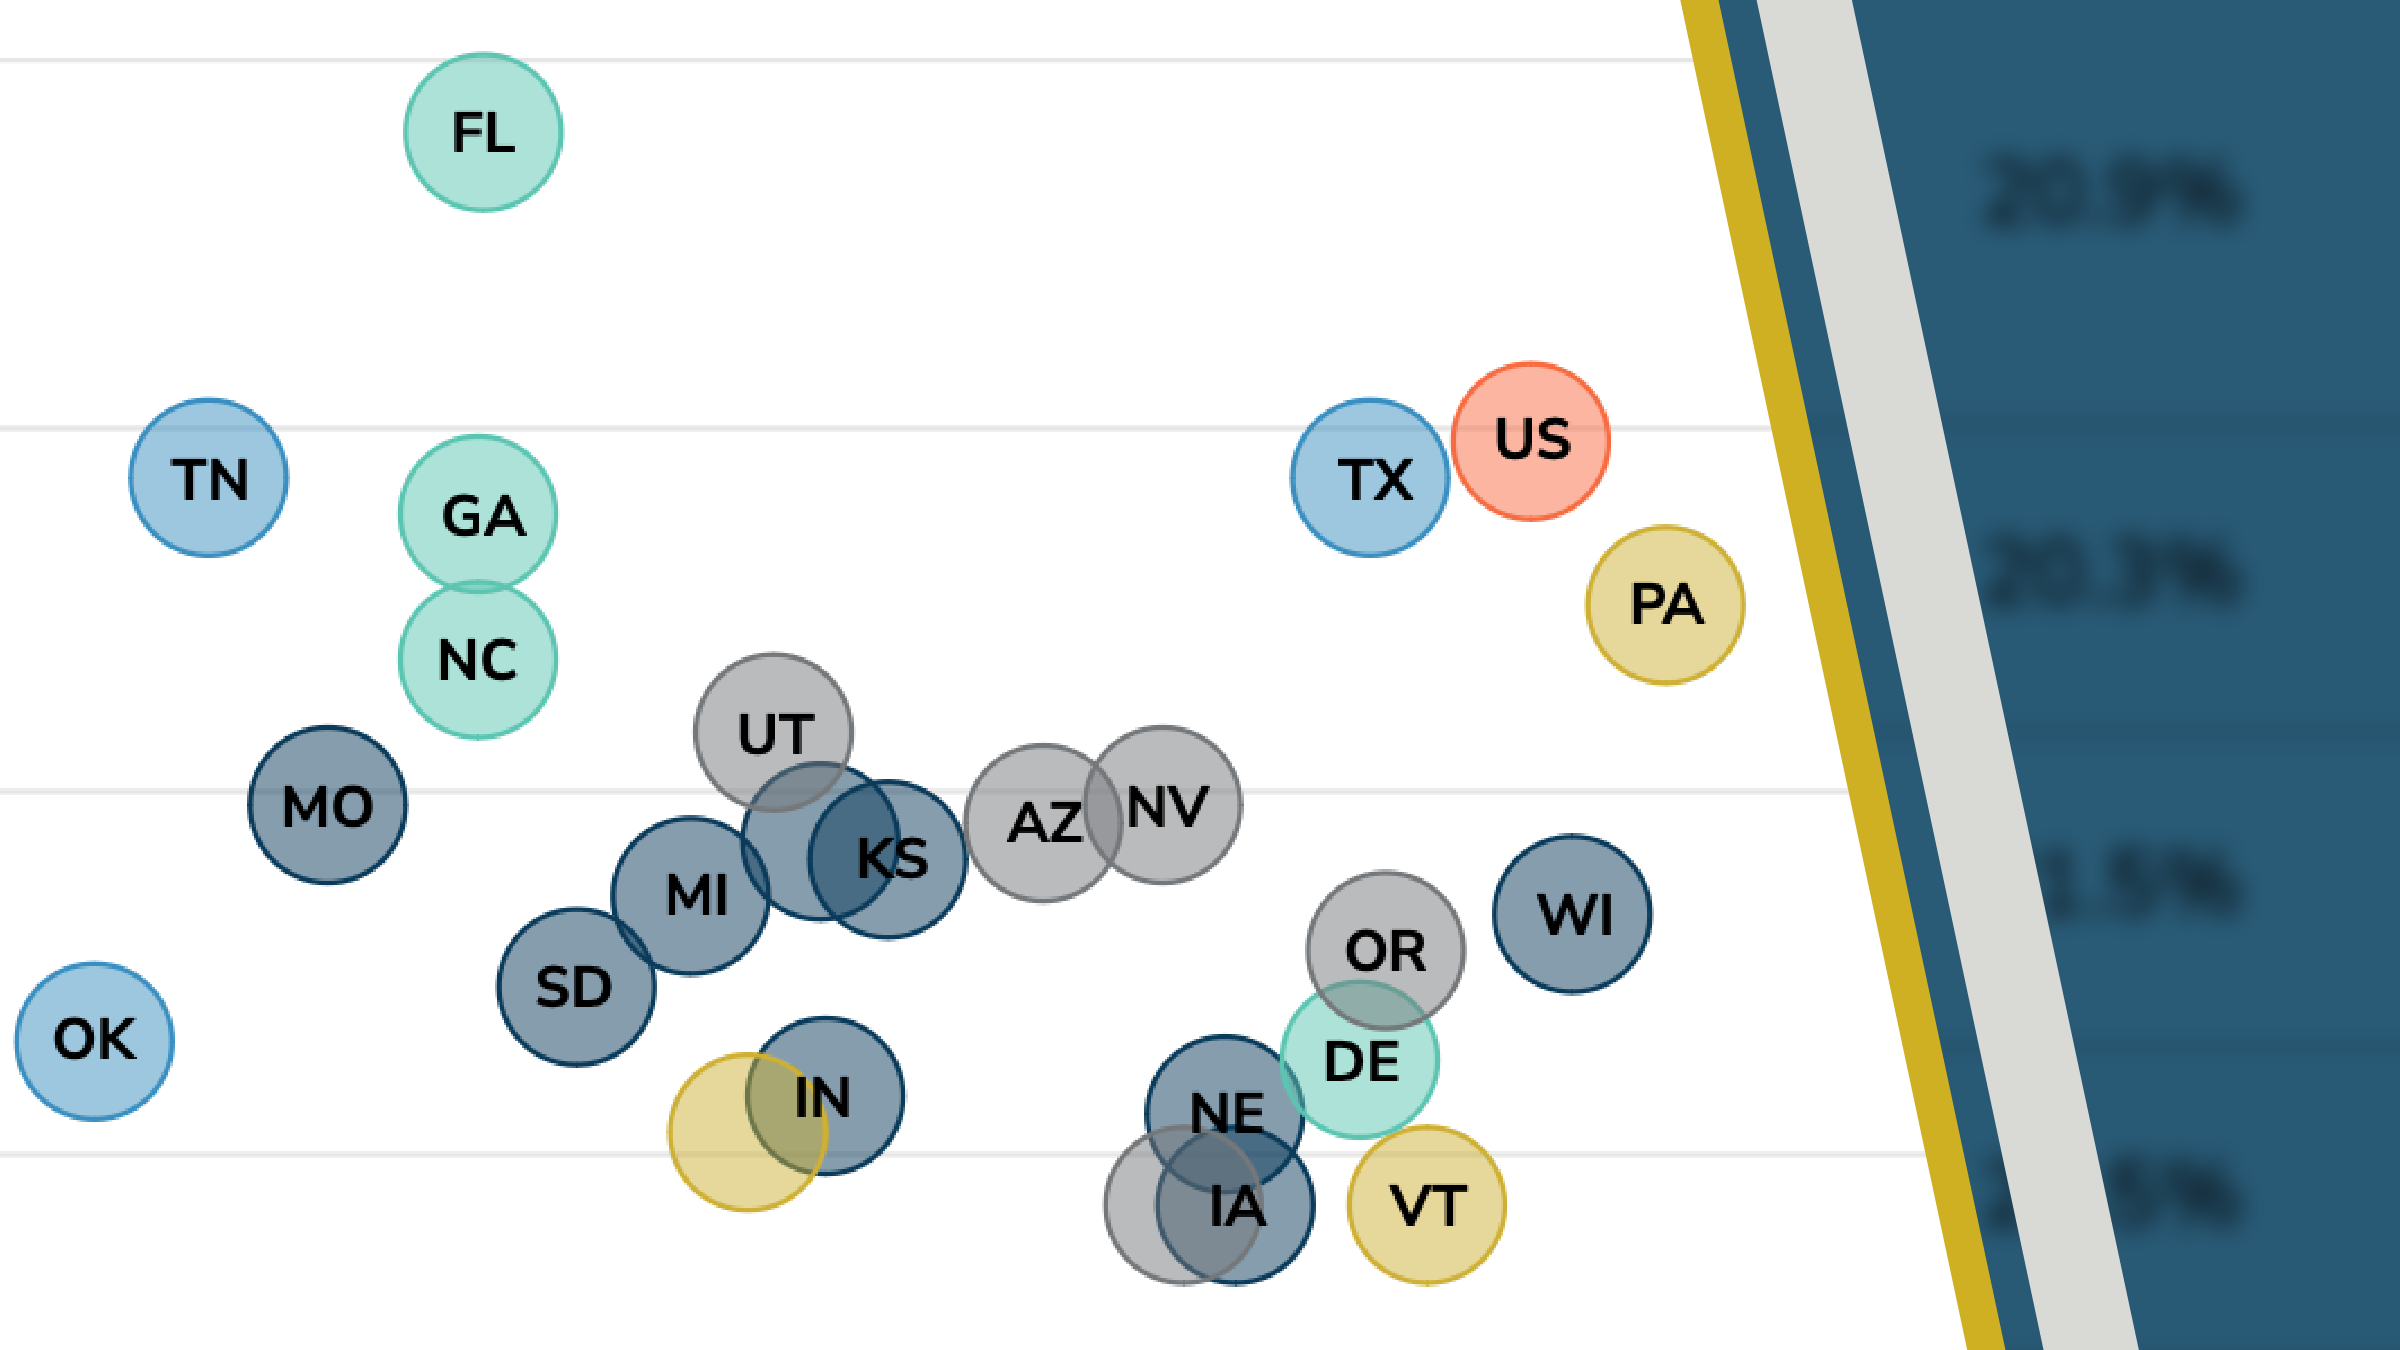
If workers and employers were perfectly mobile, always willing to relocate to where the open jobs or available workers were, we might expect such differences in unemployment rates to even out over time. But in a recent Institute working paper, economists Moritz Kuhn, Iourii Manovskii, and Xincheng Qiu show that not only is there wide variation, this variation is strikingly persistent. This persistence is illustrated in the chart below, which plots the unemployment rates in the years 2000 and 2019 for 690 local labor markets, or "commuting zones," covering the United States.1
Each dot is a community with a story to tell—some of persistence, others of change. Click the large colored dots to read some of their stories.

Uvalde and Eagle Pass, Texas
Unemployment rate in 2000: 10.9%
Unemployment rate in 2019: 5.9%
After recording the nation’s second-highest unemployment rate in 2000, these communities—like others along the Texas-Mexico border—experienced dramatic economic improvement. A major factor, according to analysis by the Dallas Fed: They successfully adapted to support the booming Mexican manufacturing economies across the border.
Note: Each dot gives the unemployment rates in 2000 and 2019 for a commuting zone, which is a geographic unit of analysis defined by the federal government that is intended to reflect the local economy where people live and work. Choosing different years changes exactly where the dots fall but not how closely clustered they are along a diagonal line.
Source: “The Geography of Job Creation and Destruction,” by Kuhn, Manovskii, and Qiu (2024).
Endnote
1 Commuting zones vary in population size from under 1,900 to almost 9 million (as of the year 2000). The sample size of smaller zones should be taken into account when interpreting the data. Like the original research, this chart excludes one extreme outlier (Yuma, Arizona).
This article is featured in the fall 2024 issue of For All, the magazine of the Opportunity & Inclusive Growth Institute
Jeff Horwich is the senior economics writer for the Minneapolis Fed. He has been an economic journalist with public radio, commissioned examiner for the Consumer Financial Protection Bureau, and director of policy and communications for the Minneapolis Public Housing Authority. He received his master’s degree in applied economics from the University of Minnesota.
Lisa Camner McKay is a senior writer with the Opportunity & Inclusive Growth Institute at the Minneapolis Fed. In this role, she creates content for diverse audiences in support of the Institute’s policy and research work.


