
Market-Based Probabilities: A Tool for Policymakers [PDF]
Ron Feldman, Ken Heinecke, Narayana Kocherlakota, Sam Schulhofer-Wohl and Tom Tallarini
Nontechnical Background Information
We can observe the current prices of assets (commodities like gold or wheat, or financial assets like stocks) from transactions that are taking place every instant in markets all over the world. But the public and policymakers often need to make decisions that depend on what’s going to happen to asset prices in the future. For a large number of assets, we use prices from option markets to estimate the chance or probability of future changes in that asset’s price. Thus, on this web page we provide estimates of the probability of a 20% increase in the S&P 500 over the coming year, or the probability of a 20% fall in the dollar value of the euro over the next six months.
To be more precise, we provide option market based estimates of probabilities. We do so because the Federal Reserve Bank of Minneapolis has concluded that the economic policymakers will typically find market-based probabilities useful in their decision-making. Most importantly, the market-based probability accounts for how valuable resources will be in the future relative to today. For example, suppose we find that the market-based probability of a 20% fall in real estate prices is larger than the market-based probability of a 20% increase in real estate prices. We can conclude that market participants’ current valuation of resources in the former “large decline” case is higher than their current valuation of resources in the latter “large increase” case. Policymakers can best compare current economic costs against future economic benefits (or vice versa) if they make use of this kind of information about the current valuation of future resources. Market-based probabilities are often described to by economists as risk-neutral probabilities.
More Technical Information:
Definitions of Statistics Used in MPD Analysis
| Mean = |
| Standard deviation = |
| Skew = |
| Kurtosis = |
Methodology for Estimating Market Probability Density Functions
How the Minneapolis Fed estimates Market Probability Density Functions [PDF]
Research/Analysis/Speeches
Market-Based Probabilities: A Tool for Policymakers [PDF]
Ron Feldman, Ken Heinecke, Narayana Kocherlakota, Sam Schulhofer-Wohl and Tom Tallarini
Optimal Outlooks
Narayana Kocherlakota
New York, New York, September 20, 2013
Optimal Outlooks - Executive Summary
Narayana Kocherlakota
Ann Arbor, Michigan, June 8, 2012
Optimal Outlooks - Executive Summary
Narayana Kocherlakota
Minneapolis, Minnesota, June 3, 2012
Latest Report
February 24, 2017 [PDF]
Commentary
Median inflation expectations rose for both the 1- and 5-year tenors over the two week period. The market probability of high inflation, defined as the market probability of more than 3% inflation, has risen in unison for both tenors since August 31, 2016. Treasury prices were lower, while LIBOR rates increased modestly. The S&P 500 returned 3% over the two week period; the 20 banks and 11 insurance firms we follow outperformed the market index, returning 5.1% and 4%, respectively. MPD standard deviation was lower for the S&P 500 by an average -0.6 percentage points; banks and insurance posted similar declines. Notably, 8 insurance firms posted 12-month lows for MPD standard deviation within the past 4 weeks. The dollar was stronger against all currency we follow. Since the start of the year (January 1, 2017) the dollar has gained against all currencies.
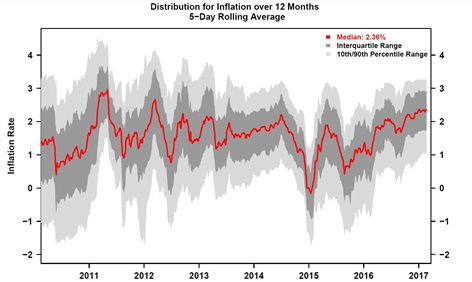
Inflation
Market-based inflation expectations derived from caps and floors on the CPI for 1- and 5-year periods were higher for both tenors. The 1-year increased by 5.2 bps to 2.36% and the 5-year rose by 4.9 bps to 2.19%. The increased level registered by the 1-year tenor is shown for reference (see figure, below).
Additional detail:
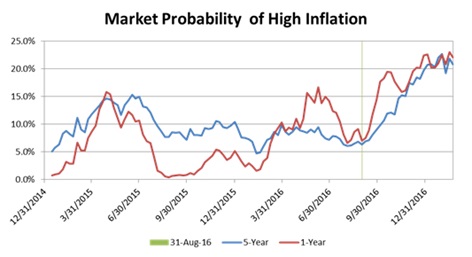
- Since August 31, 2016 the market probability of high inflation has risen by 0.5 percentage points per week, on average, for both tenors (see chart, below).
Interest Rate
Treasury prices fell over the two week period: The 5-year was lower by -0.4%, and the 10-year decreased by -0.5%. As a result, yields rose. Changes in MPD standard deviation have been flat for both tenors since November 30, 2016. MPD skews currently signal neutral bias. Both LIBOR tenors were higher; the 3-year tenor rose by 12 bps, and the 5-year tenor increased by 23 bps. The 5-year tenor experienced the largest movements in MPD metrics with MPD standard deviation rising by 0.2 percentage points and the skew increasing by 1.1. MPD skews for both tenors signal investor bias towards higher future LIBOR rates.
Banks and Insurance Companies
The S&P 500 jumped by 3% over the past two weeks to a new 47-month high. MPD standard deviation fell slightly for both the 6- and 12-month tenor by an average of -0.5 percentage points. The 20 banking firms we follow outperformed the S&P 500, posting a 5.1% return. The 11 insurance companies we follow rose by 4% on average, also outperforming the broader market index.
Additional details:
- While MPD standard deviation for banks fell in line with the S&P 500 at -0.3 percentage points, the average decrease for insurance companies was nearly 4 times larger at -1.3 percentage points. Notably, within the past 4 weeks, MPD standard deviation for 8 of the 11 insurance firms is at a 12-month low implying that investor uncertainty has fallen for the firms in question.
Other Markets
- The iShares US Real Estate Index underperformed the market, returning 2.4%. Its MPD standard deviation fell in line with the broader market, decreasing by -0.33 percentage points.
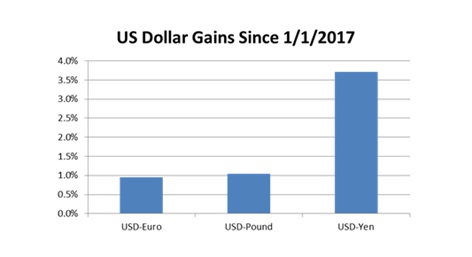
- The dollar was stronger against all currencies we follow; MPD standard deviation was lower for all tenors. The dollar has positive gains against all currencies since the start of this year. In particular the dollar has gained the most against the yen (see plot, below).
- Gold and silver moved in opposite directions. Gold was lower by -0.5%; however, silver was higher by 1.4%. MPD standard deviation fell by -0.45 percentage points for both metals, on average.
- WTI crude increase by 0.4% over the 2 week period. MPD standard deviation fell by -2 percentage points setting a new 1-year low.
- Soybeans fell by -3.1%, while wheat increased by 3%. MPD standard deviation increased for both corn and wheat by an average of 2.8 percentage points, signaling that investor uncertainty has risen for both crops.
- Lean hogs registered a -1.3% decline, while the MPD standard deviation rose by 0.9 percentage points.
Feedback
Please send comments and suggestions to: option-report-feedback@mpls.frb.org.
Archive of past exhibits
- February 10, 2016 [pdf] (exhibits)
- January 27, 2016 [pdf] (exhibits)
- January 6, 2016 [pdf] (exhibits)
- December 16, 2016 [pdf] (exhibits)
- December 2, 2016 [pdf] (exhibits)
- November 18, 2016 [pdf] (exhibits)
- November 4, 2016 [pdf] (exhibits)
- October 14, 2016 [pdf] (exhibits)
- September 23, 2016 [pdf] (exhibits)
- September 2, 2016 [pdf] (exhibits)
- August 19, 2016 [pdf] (exhibits)
- August 5, 2016 [pdf] (exhibits)
- July 22, 2016 [pdf] (exhibits)
- July 8, 2016 [pdf] (exhibits)
- June 24, 2016 [pdf] (exhibits)
- June 9, 2016 [pdf] (exhibits)
- May 28, 2016 [pdf] (exhibits)
- April 29, 2016 [pdf] (exhibits)
- April 15, 2016 [pdf] (exhibits)
- April 1, 2016 [pdf] (exhibits)
- March 18, 2016 [pdf] (exhibits)
- March 4, 2016 [pdf] (exhibits)
- February 19, 2016 [pdf] (exhibits)
- February 5, 2016 [pdf] (exhibits)
- January 22, 2016 [pdf] (exhibits)
- January 8, 2016 [pdf] (exhibits)
- December 18, 2015 [pdf] (exhibits)
- December 4, 2015 [pdf] (exhibits)
- November 13, 2015 [pdf] (exhibits)
- October 16, 2015 [pdf] (exhibits)
- October 2, 2015 [pdf] (exhibits)
- September 18, 2015 [pdf] (exhibits)
- September 4, 2015 [pdf] (exhibits)
- August 21, 2015 [pdf] (exhibits)
- August 7, 2015 [pdf] (exhibits)
- July 24, 2015 [pdf] (exhibits)
- July 10, 2015 [pdf] (exhibits)
- June 19, 2015 [pdf] (exhibits)
- June 5, 2015 [pdf] (exhibits)
- May 22, 2015 [pdf] (exhibits)
- May 8, 2015 [PDF] (exhibits)
- April 24, 2015 [PDF] (exhibits)
- April 10, 2015 [PDF] (exhibits)
- March 27, 2015 [PDF] (exhibits)
- March 13, 2015 [PDF] (exhibits)
- February 27, 2015 [PDF] (exhibits)
- February 13, 2015 [PDF] (exhibits)
- January 30, 2015 [PDF] (exhibits)
- January 14, 2015 [PDF] (exhibits)
- January 2, 2015 [PDF] (exhibits)
- December 10, 2014 [PDF] (exhibits)
- November 28, 2014 [PDF] (exhibits)
- November 14, 2014 [PDF] (exhibits)
- October 31, 2014 [PDF] (exhibits)
- October 17, 2014 [PDF] (exhibits)
- October 3, 2014 [PDF] (exhibits)
- September 19, 2014 [PDF] (exhibits)
- September 4, 2014 [PDF] (exhibits)
- August 21, 2014 [PDF] (exhibits)
- August 7, 2014 [PDF] (exhibits)
- July 24, 2014 [PDF] (exhibits)
- July 10, 2014 [PDF] (exhibits)
- June 12, 2014 [PDF] (exhibits)
- May 29, 2014 [PDF] (exhibits)
- May 15, 2014 [PDF] (exhibits)
- May 1, 2014 [PDF] (exhibits)
- April 17, 2014 [PDF] (exhibits)
- April 3, 2014 [PDF] (exhibits)
- March 20, 2014 [PDF] (exhibits)
- March 6, 2014 [PDF] (exhibits)
- February 20, 2014 [PDF] (exhibits)
- February 6, 2014 [PDF] (exhibits)
- January 23, 2014 [PDF] (exhibits)
- January 9, 2014 [PDF] (exhibits)
- December 12, 2013 [PDF] (exhibits)
- November 28, 2013 [PDF] (exhibits)
- November 14, 2013 [PDF] (exhibits)
- October 31, 2013 [PDF] (exhibits)
- October 17, 2013 [PDF] (exhibits)
- October 3, 2013 [PDF] (exhibits)
- September 19, 2013 [PDF] (exhibits)
- September 5, 2013 [PDF] (exhibits)
- August 22, 2013 [PDF] (exhibits)
- August 8, 2013 [PDF] (exhibits)
- July 24, 2013 [PDF] (exhibits)
- July 11, 2013 [PDF] (exhibits)
- June 28, 2013 [PDF] (exhibits)
- June 14, 2013 [PDF] (exhibits)
- May 30, 2013 [PDF] (exhibits)
- May 16, 2013 [PDF] (exhibits)
- May 3, 2013 [PDF] (exhibits)
- April 19, 2013 [PDF] (exhibits)
- April 4, 2013 [PDF] (exhibits)
- March 21, 2013 [PDF] (exhibits)
- March 7, 2013 [PDF] (exhibits)
- February 21, 2013 [PDF] (exhibits)
- January 24, 2013 [PDF] (exhibits)
- January 10, 2013 [PDF] (exhibits)
- December 27, 2012 [PDF] (exhibits)
- December 13, 2012 [PDF] (exhibits)
- November 29, 2012 [PDF] (exhibits)
- November 15, 2012 [PDF] (exhibits)
- November 1, 2012 [PDF] (exhibits)
- October 18, 2012 [PDF] (exhibits)
- October 4, 2012 [PDF] (exhibits)
- September 20, 2012 [PDF] (exhibits)
- September 6, 2012 [PDF] (exhibits)
- August 23, 2012 [PDF] (exhibits)
- August 9, 2012 [PDF] (exhibits)
- July 26, 2012 [PDF] (exhibits)
- July 12, 2012 [PDF] (exhibits)
- June 28, 2012 [PDF] (exhibits)
- June 14, 2012 [PDF] (exhibits)
- May 31, 2012 [PDF] (exhibits)
- May 17, 2012 [PDF] (exhibits)
- May 3, 2012 [PDF] (exhibits)
- April 19, 2012 [PDF] (exhibits)
- April 5, 2012 [PDF] (exhibits)
- March 22, 2012 [PDF] (exhibits)
- March 8, 2012 [PDF] (exhibits)
- February 23, 2012 [PDF] (exhibits)
- February 9, 2012 [PDF] (exhibits)
- January 26, 2012 [PDF] (exhibits)
- January 12, 2012 [PDF] (exhibits)
- December 29, 2011 [PDF] (exhibits)
- December 15, 2011 [PDF] (exhibits)
- December 1, 2011 [PDF] (exhibits)
- November 18, 2011 [PDF] (exhibits)
- November 3, 2011 [PDF] (exhibits)
- October 20, 2011 [PDF] (exhibits)
- October 6, 2011 [PDF] (exhibits)
- September 23, 2011 [PDF] (exhibits)
- September 8, 2011 [PDF] (exhibits)
- August 26, 2011 [PDF] (exhibits)
- August 11, 2011 [PDF] (exhibits)
- July 29, 2011 [PDF] (exhibits)
- June 29, 2011 [PDF] (exhibits)
- May 31, 2011 [PDF] (exhibits)
- April 29, 2011 [PDF] (exhibits)
- March 31, 2011 [PDF] (exhibits and appendix)
- February 28, 2011 [PDF] (exhibits and appendix)
- January 31, 2011 [PDF] (exhibits and appendix)
- December 31, 2010 [PDF] (exhibits and appendix)
- November 30, 2010 [PDF] (exhibits and appendix)
- October 31, 2010 [PDF] (exhibits and appendix)
- September 30, 2010 [PDF] (exhibits and appendix)
- August 24, 2010 [PDF] (exhibits and appendix)