
Ninth District Surveys
1 – 12 of 199


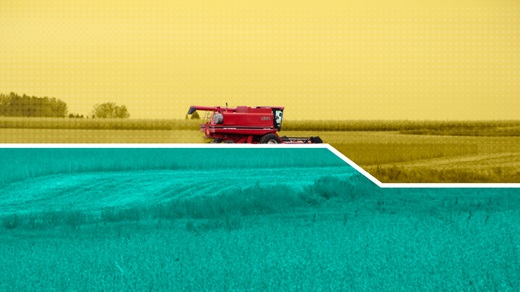
Farmers limped across the finish line at year-end
February 21, 2025

Manufacturers are optimistic for 2025, even after a down year
February 7, 2025

Despite generally good harvests, farm incomes declined
November 15, 2024


Agricultural credit conditions: Fourth-quarter 2023
April 19, 2024

Businesses continue to struggle with high prices and interest rates
February 22, 2024

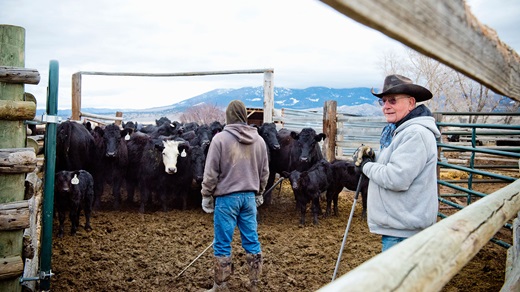
Farm hands needed
December 15, 2023
Farm incomes fell going into harvest, but finances remained solid
November 15, 2023

Farm incomes flattened heading into summer
August 29, 2023