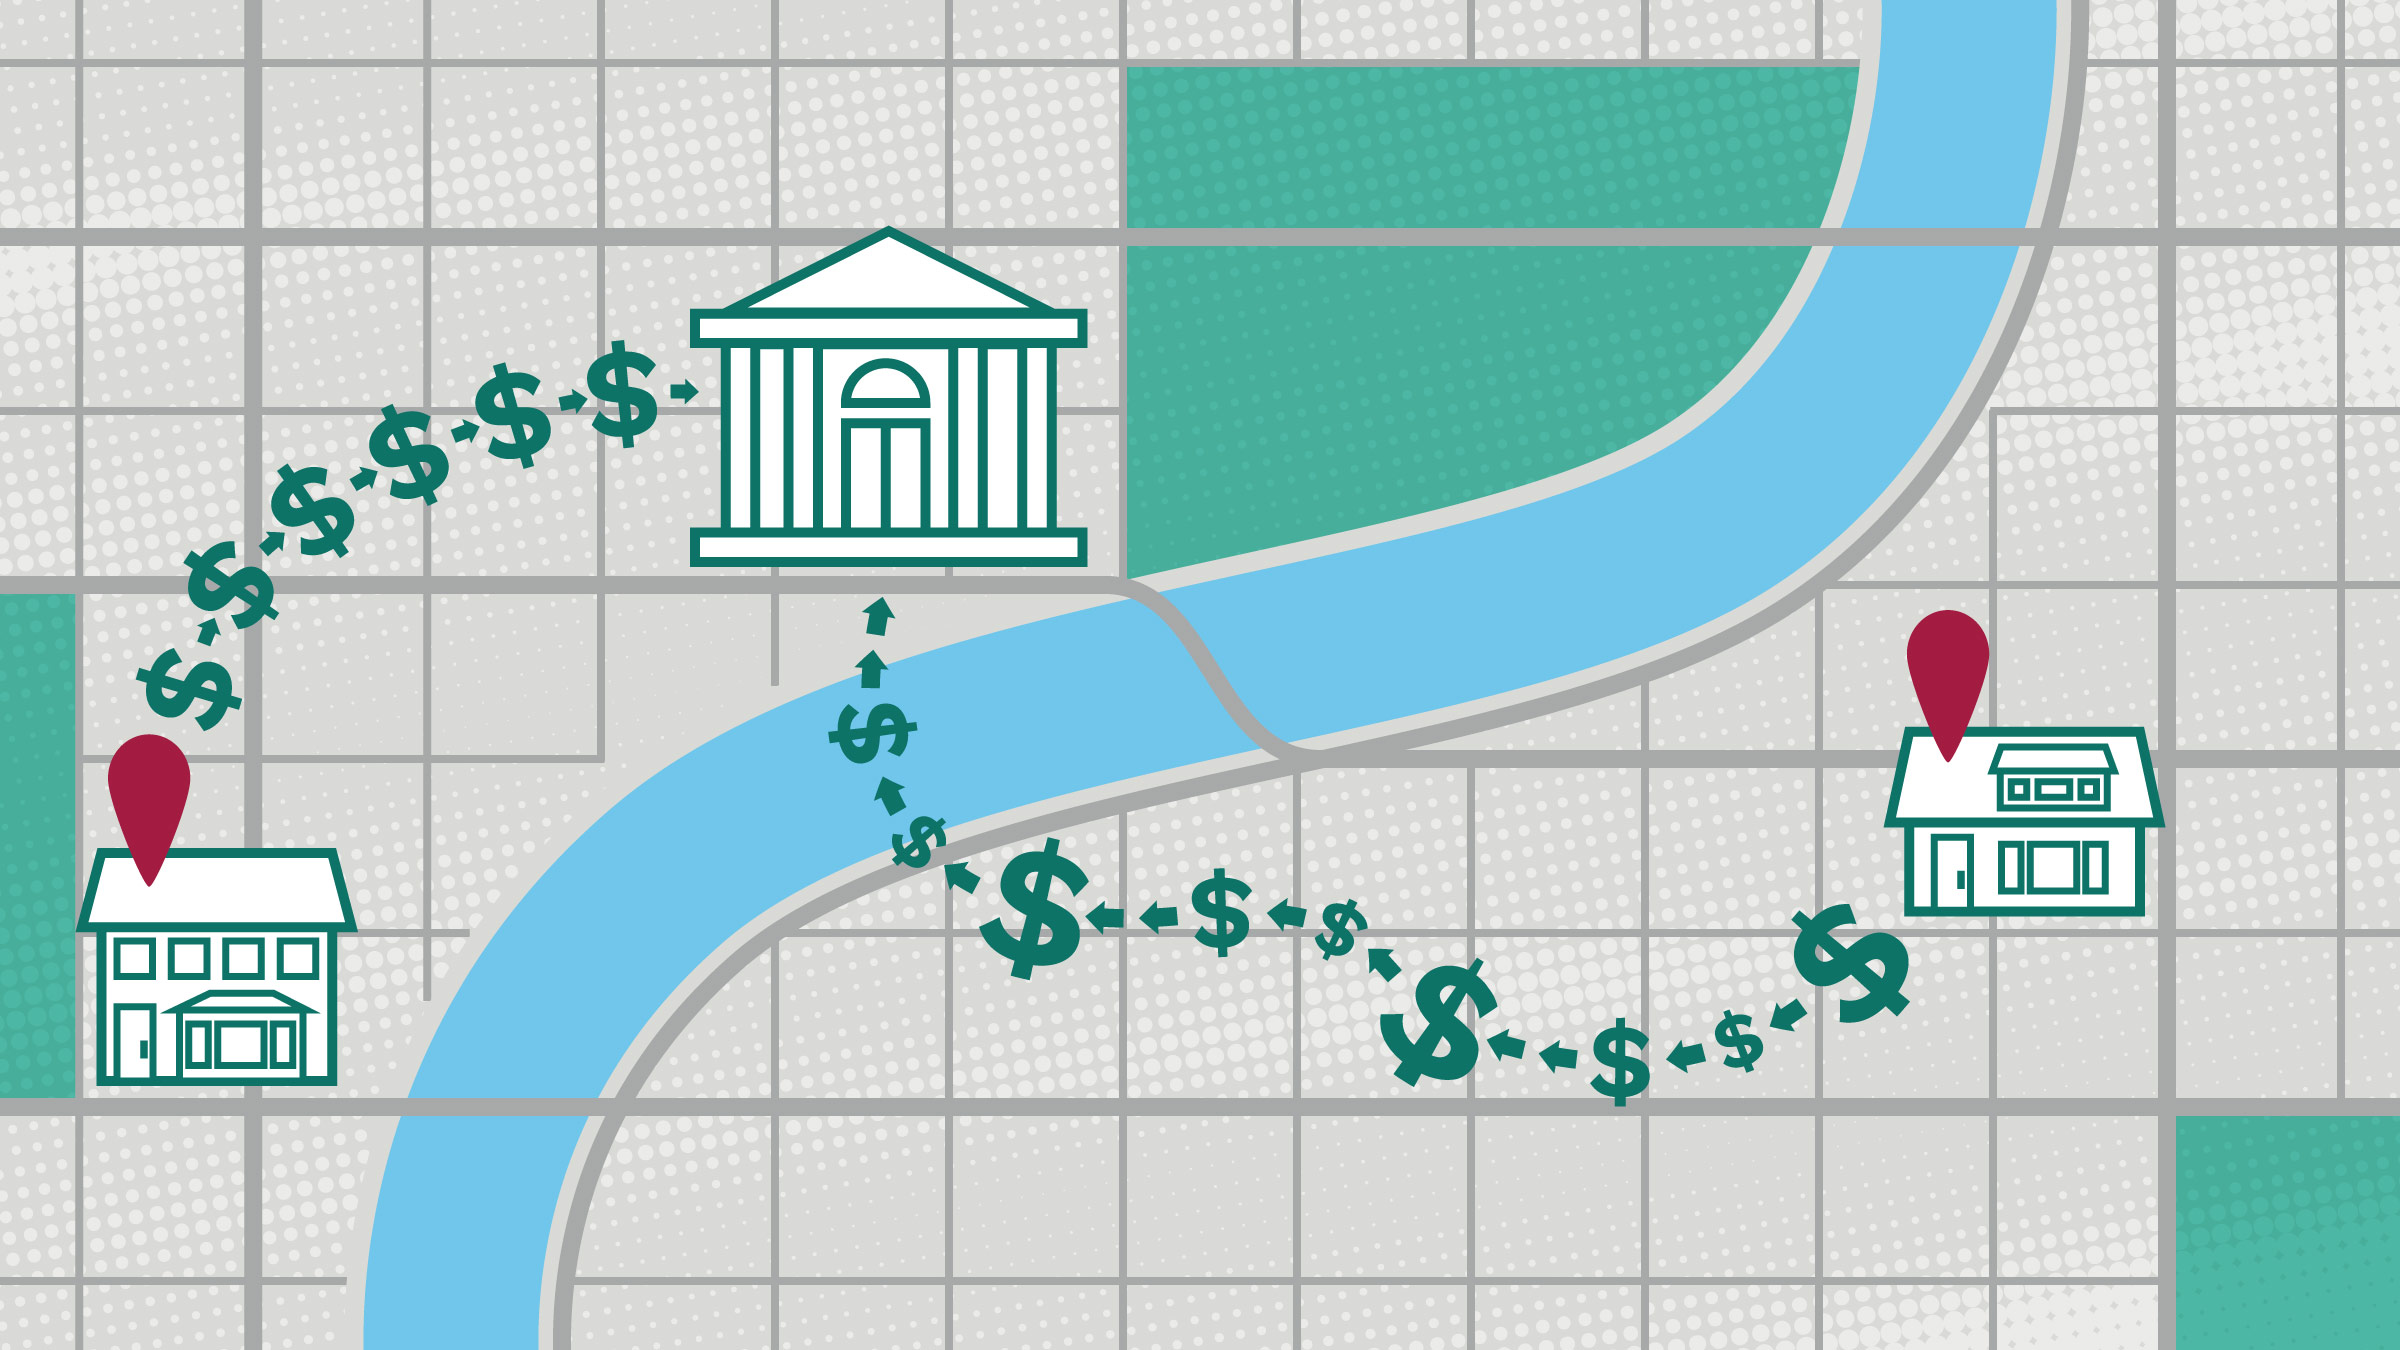
Neighborhoods change. People move in and out, businesses prosper or stall, and the built environment transforms as both populations and enterprises alter the surroundings to meet their needs. By understanding how areas change, and by demonstrating the changes through a multitude of data indicators, policymakers, scholars, community developers, and others who are interested in the growth and direction of a community may better prepare for the future needs of its residents and businesses.
To begin exploring whether credit history data can provide timely indicators of local neighborhood change, the Community Development Department of the Minneapolis Fed examined changes in credit risk scores of 25- to 44-year-old residents of cities and neighborhoods in the Twin Cities metropolitan region over the past decade.[1] A credit risk score indicates how likely a person is to pay back a debt; the higher the score, the more likely the person is to repay. Since the scores are widely used by banks and other institutions to make decisions about whom to lend to, rent to, or hire, demand for up-to-date scores is high. As a result, credit scores are kept up-to-date by their issuers (i.e., the three major credit bureaus: Equifax, TransUnion, and Experian), unlike census statistics and many other sources of neighborhood demographic data. Credit scores also tend to be correlated with income and other aspects of financial strength.[2] As a result, a change in a neighborhood’s average credit risk score may serve as a timely indicator of broader neighborhood changes that are not yet apparent in publicly available demographic data.[3] We chose to analyze the 25- to 44-year-old cohort because of its association with people who buy homes for the first time, become parents, and, sometimes, establish roots in a community. Collectively, where these people choose to live can have long-term ramifications on the social, educational, and economic aspects of the communities they live in—on the schools, the tax base, the housing prices, and the retail establishments, to name several.
Using a dataset that contains consumer credit profiles of a 5 percent sample of the U.S. population, we sought to understand how the credit risk scores of 25- to 44-year-olds changed, by both neighborhood and city, between 2005 and 2015. To do this, we compared each area’s position in the risk score distribution in 2005 to its position in 2015 (See the sidebar below for more detail on the methodology of our analysis.)
The analysis reveals a considerable amount of change in some areas and little change in others. Viewed at the city level, the biggest swings have occurred in a downward direction: Champlin, Lino Lakes, and Forest Lake, all northern suburbs, experienced the largest relative decline in risk scores among larger cities.[4] Robbinsdale, just west of North Minneapolis, and the southern outer-ring suburb of Savage also saw relatively large declines. On the upswing were the suburbs of Edina, St. Louis Park, Richfield, and Columbia Heights. However, the epicenter of risk score improvement was Minneapolis, which, perhaps not coincidentally, shares a border with the four “upswing” suburbs. (See the table below for specific findings.) Minneapolis’s increase over 2005 levels was the highest of any large city in the area, an especially notable change given its large population base.
Within Minneapolis—the study area’s most populous city—the increase in people in the age 25–44 cohort with strong credit histories was notable in neighborhoods near downtown Minneapolis and throughout the city’s southern neighborhoods. Northeast Minneapolis also saw considerable increases. Despite this sharp rise for the city as a whole, North Minneapolis experienced little change, aside from decreases in some areas. The same was true in St. Paul, which, as a city, saw little movement.
Do these patterns actually foretell different futures for, say, Minneapolis versus St. Paul, or Columbia Heights versus Champlin? It’s too early to say. For one thing, the recent local changes in relative credit scores could reverse, as households relocate to different cities within the metro area or prosper to different degrees within each city. In addition, the idea that increases or decreases in average credit scores reflect more fundamentally important changes in the character of cities and neighborhoods remains untested, as the census and other data needed to more fully assess the degree and permanence of post-Great Recession neighborhood change have not yet been published. Over time, additional data will help us assess the degree to which credit scores can serve as early indicators of neighborhood change.
Our methodology: Details of computing the rankings
|
[1] We used U.S. Census Bureau “places” to identify cities and census-defined tracts as a proxy for neighborhoods. Typically, tracts have around 4,000 residents.
[2] For example, see page 27 of the Board of Governors of the Federal Reserve System’s Report on the Economic Well-Being of U.S. Households in 2014, available at federalreserve.gov/econresdata.
[3] Our credit history data are from the Federal Reserve Bank of New York/Equifax Consumer Credit Panel, or CCP. We use the primary CCP panel, which is based on a 5 percent sample of the Equifax credit histories of individuals with a Social Security Number. Within the CCP, the credit score we use is the Equifax Risk Score. For further background and additional details on how we process the data, see minneapolisfed.org/community/community-development/credit/datadocumentation.
[4] For this analysis, large cities are those that have 100 or more risk score observations.


