Author


Economic Policy Papers are based on policy-oriented research produced by Minneapolis Fed staff and consultants. The papers are an occasional series for a general audience. The views expressed here are those of the authors, not necessarily those of others in the Federal Reserve System.
Executive Summary
Foreign investment into China has surged since the 1990s and become a topic of keen interest for both scholars and the media. While China has encouraged this investment with the goal of catching up technologically, close analysis reveals that only a small share of its foreign investment comes from the United States and other nations with the technology China seeks.
Instead, inward foreign direct investment (FDI) flows predominantly from Hong Kong and a few Caribbean nations. Two key factors behind this: China’s tax policy toward foreign investment and its “industrial” policies to encourage development and growth. Specifically, preferential tax treatment for foreign investment leads many Chinese businesses and households to “round-trip” investments; and policies requiring joint ventures between Chinese and foreign high-tech companies—while benefiting China enormously—discourage investment by multinationals from advanced countries.
China’s economic growth: A plan for foreign investment
It’s well known that China’s economy has grown very rapidly in recent decades, in both absolute and per capita terms. From the 1990s to 2015, China’s per capita GDP increased from under 5 percent of U.S. per capita GDP to nearly 25 percent. Foreign investment has also surged in recent decades. Most foreign investment in China has been “direct” investment, meaning that the investor retains management control of the enterprise.1 Effectively prohibited prior to 1978, foreign direct investment began to grow during the 1980s as restrictions were gradually liberalized. In the early 1990s, FDI soared from just 7 percent of the U.S. level in 1990 to nearly 75 percent of the U.S. level just four years later.
The connection between growth and foreign investment is at the heart of China’s strategic plan for science and technology development. According to the China State Council, China needs to “vigorously develop the high-tech industries that can lead to breakthroughs in driving economic growth” and “place the strengthening of indigenous innovative capability at the core of economic restructuring.”2
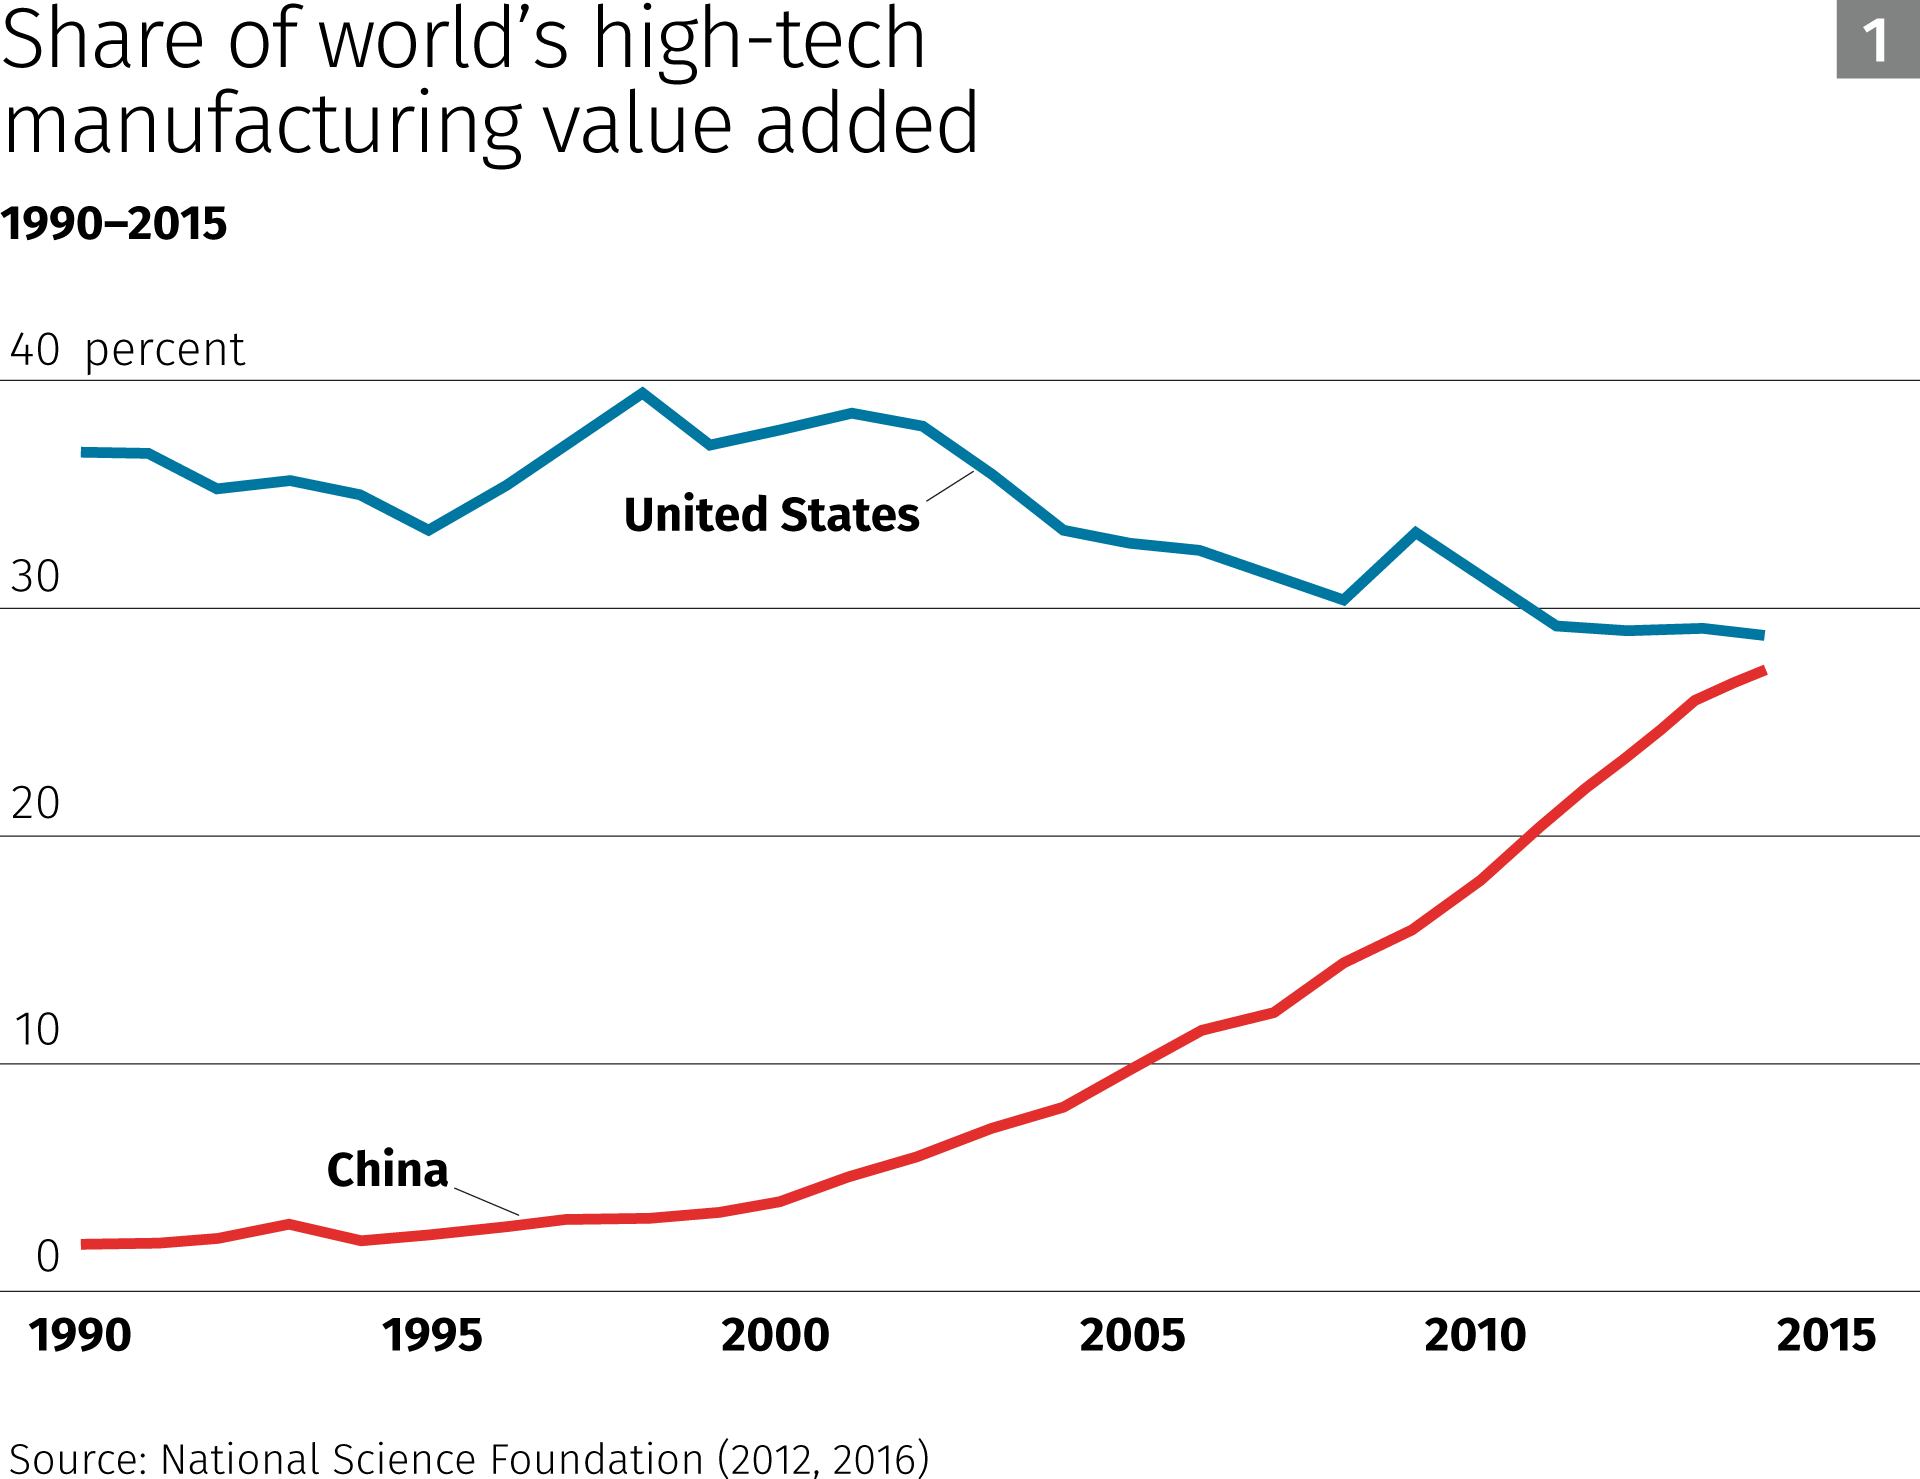
To accelerate this development, China has encouraged foreign investment in high-tech manufacturing rather than low-wage assembly. Figure 1 shows that this effort has succeeded. In 1990, the nation was a very minor contributor to global value-added production, but by 2014 it had nearly caught up to the United States in this dimension, with each nation accounting for almost 30 percent of world high-technology manufacturing value added.3 Thus, assuming that China is seeking to “[strengthen] its indigenous innovation,” the data seem to indicate that the strategic plan is working.
But a deeper look at the sources of China’s foreign investment leads to some puzzling findings.
Investment into and out of China
Further examination of investments reported by China reveals a striking fact: Little comes from the United States or other advanced economies, and little flows in the opposite direction. If China’s goal is to catch up to the technological frontier quickly, one would expect to see large investments from countries like the United States, especially given the fact that American companies are interested in accessing China’s vast consumer market. And if China has in fact been catching up technologically, one would expect foreign investment to start flowing in the opposite direction.
Figure 2 reports total direct investment flows into China as reported by the Chinese government, with portions coming from the United States, Western Europe,4 Japan, Hong Kong, British Virgin Islands (BVI), Cayman Islands and all other nations. From 1990 to 1994, total inward FDI to China amounted to $24 billion (in 2014 U.S. dollars). Of this, about 7 percent was from the United States, 4 percent from Western Europe and 7 percent from Japan, totaling 18 percent from advanced economies, with 82 percent from other nations. Twenty years later, China’s FDI had nearly quintupled to $118 billion, but an even smaller share came from the United States (2.3 percent) and the share of FDI from advanced countries fell to roughly 13 percent, with 87 percent coming from other nations.5
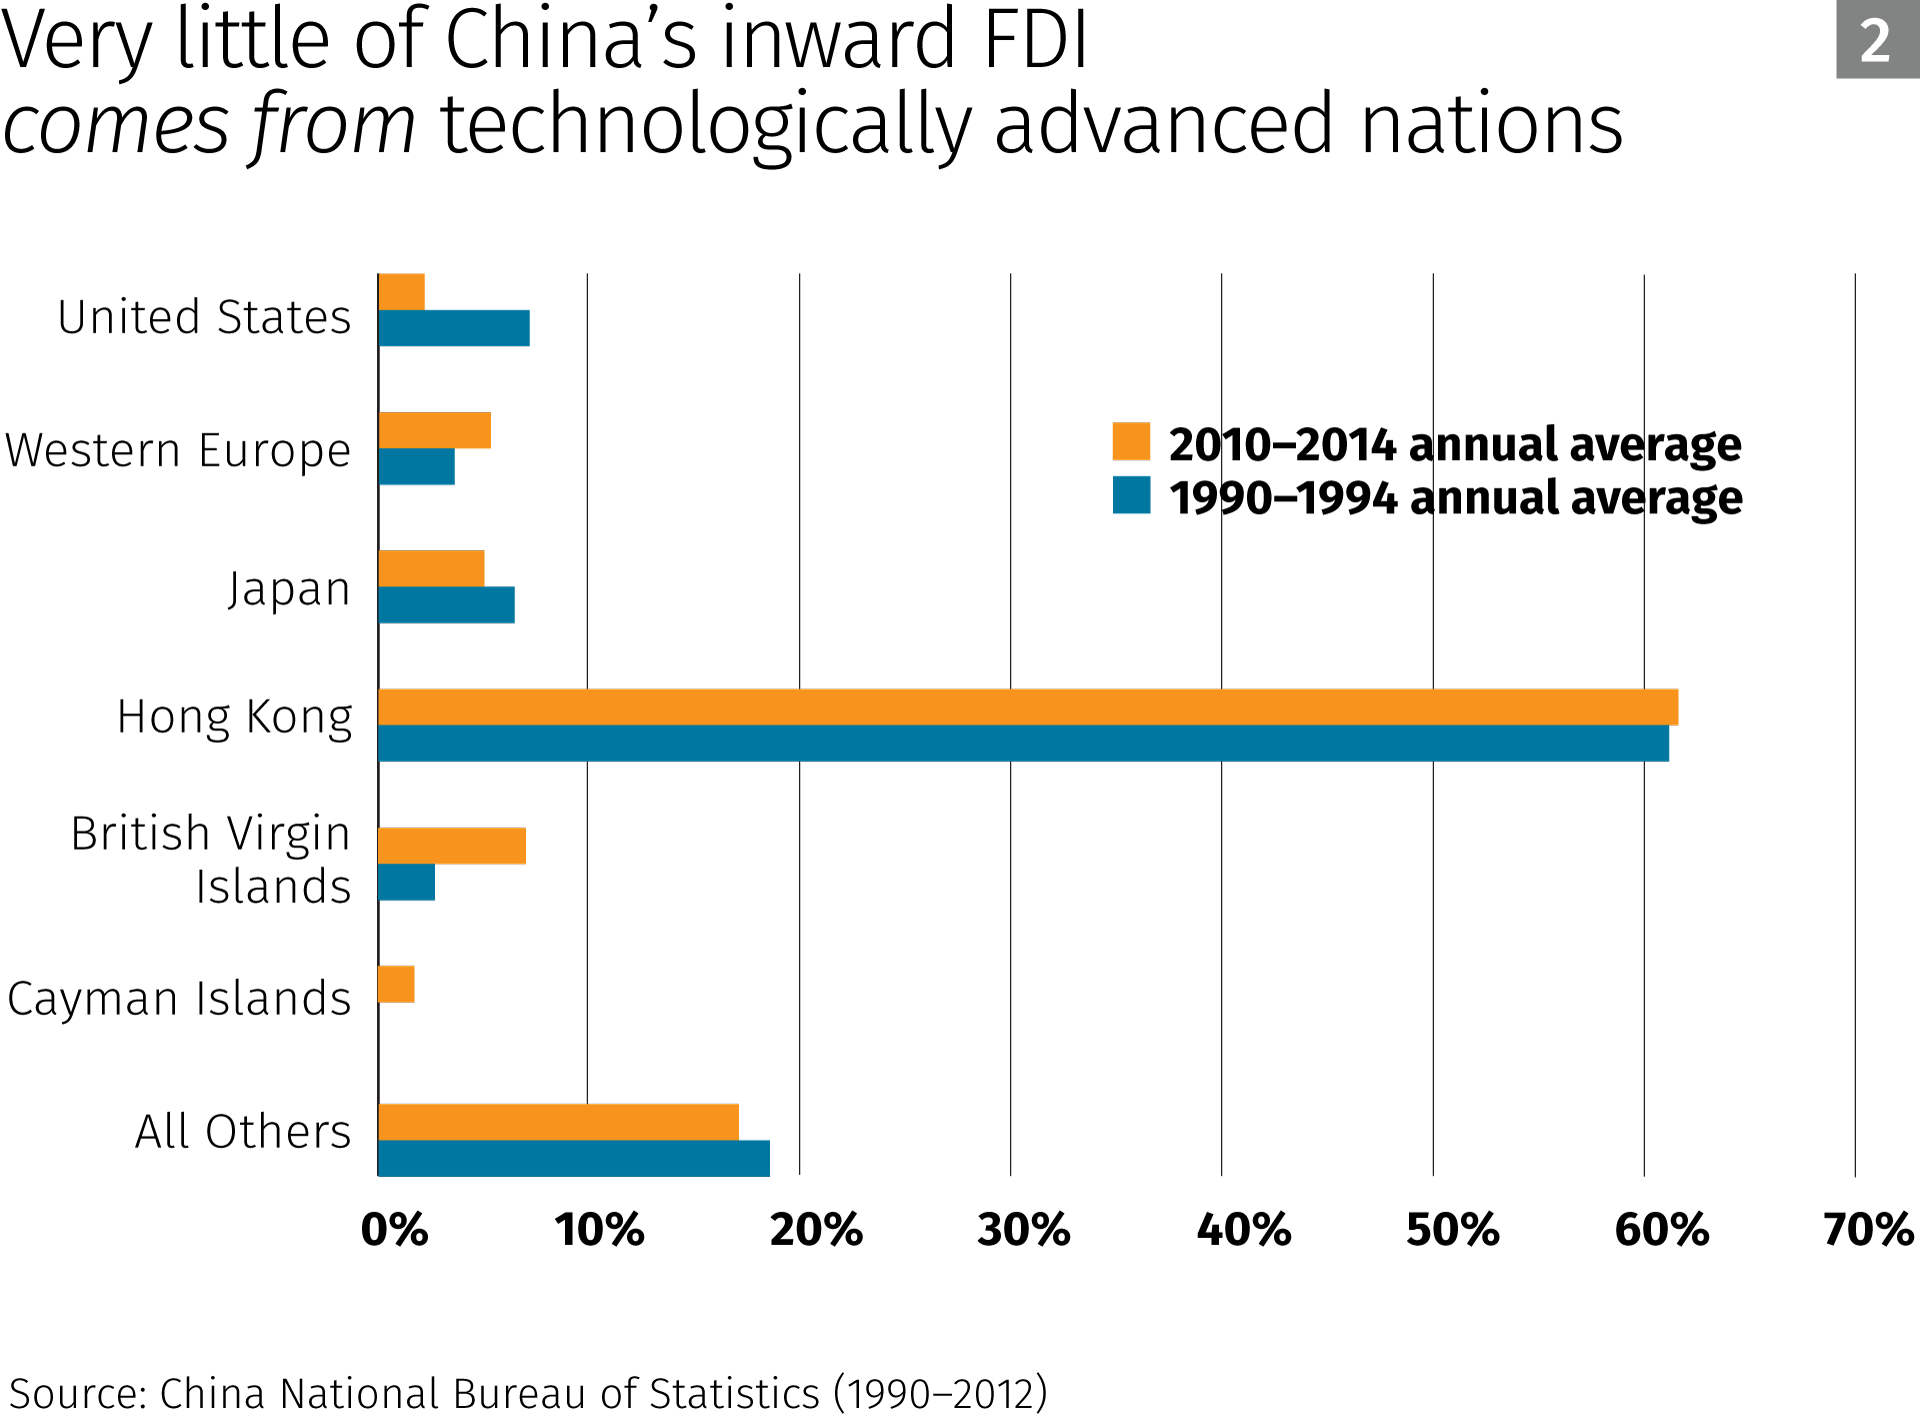
If the vast majority of China’s investment is not coming from countries with advanced technology, then where does it come from? The answer, also evident in Figure 2, is that much of China’s inward FDI comes from Hong Kong and two small islands in the Caribbean: BVI and Cayman Islands. These three nations account for an average of 64 percent of China’s inward investment flows in 1990-94, and 70 percent in 2010-14.
Figure 3 reports similar facts for outgoing investments from China to the rest of the world. The Chinese government reports that outward FDI averaged only $4 billion per year (in 2014 U.S. dollars) over the period 1990-94, which is one-sixth the magnitude of inward flows. The Chinese government does not provide a country breakdown for those years, but according to U.S. statistics, the United States received only 1 percent of this investment. Two decades later, China’s outward FDI averaged $95 billion with 4 percent going to the United States and roughly 12 percent going to technologically advanced countries, including those in Western Europe and Japan.
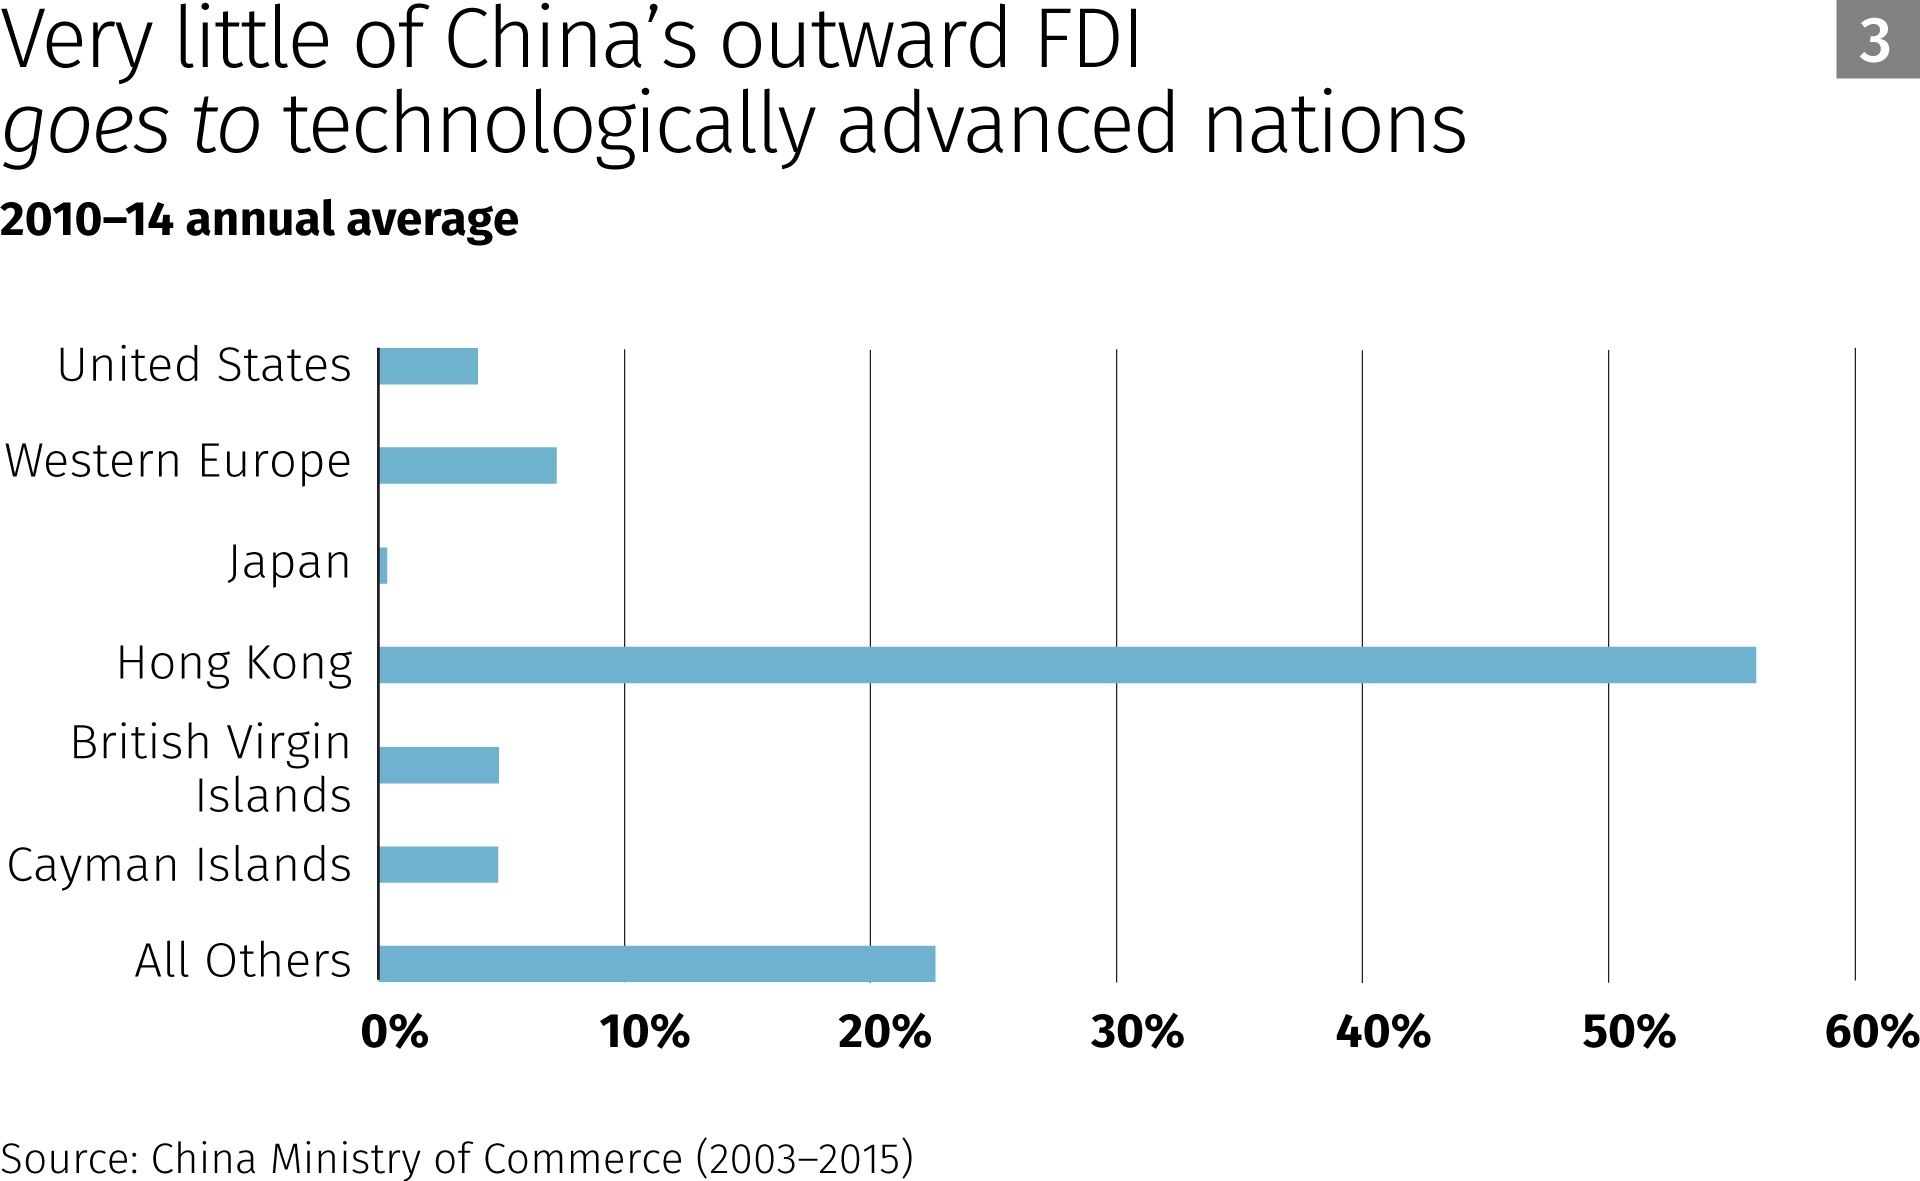
As is the case for China’s inward flows, the primary destinations of its outward flows are Hong Kong, BVI and the Cayman Islands. In 2010-14, the outward flows to these three nations totaled $62.6 billion, or about 66 percent of all flows, with each of these nations receiving more than the United States.
Policy analysis
While the global patterns of China’s FDI seem puzzling on the surface, particularly given the national priority of rapid high-tech innovation, the mystery dissolves when China’s tax and industrial policies are considered.
To encourage inward flow of capital, China gave preferential tax treatment to FDI prior to 2008. Most important of these preferential policies were lower corporate tax rates and tax bases for foreign investors. This led many Chinese firms and wealthy families to “round-trip” their investment by sending it abroad and then pulling it back in the guise of FDI (Xiao 2004). The destination of choice for round-tripping was Hong Kong for many years prior to the 1997 transfer of sovereignty from the United Kingdom to China. Another preferred haven then became Caribbean islands with British ties, especially BVI and the Caymans. Sutherland and Matthews (2009) find evidence that suggests several additional advantages for Chinese firms establishing Caribbean subsidiaries, such as facilitation of raising foreign capital.
China’s quid pro quo policy also helps account for the unusual global investment flow. Chinese policy requires multinational firms that want access to China’s huge market to transfer partial property rights to their technology, often through R&D centers or joint ventures with Chinese firms (Holmes, McGrattan and Prescott 2015a, 2015b). This quid pro quo requirement discourages direct high-tech investment in China from firms based in advanced economies. Furthermore, if property rights transferred to China are restricted to sales within China, China is less likely to invest overseas since its quid pro quo arrangement permits only domestic—not foreign—sales of goods manufactured with transferred technology.
Taken together, China’s preferential tax policies and quid pro quo policy appear to explain why Hong Kong and select islands in the Caribbean account for far more foreign investment into and out of China than the technologically advanced nations whose know-how China hopes to acquire in order to strengthen “indigenous innovative capability.”
Endnotes
1 Management control is usually represented by 10 percent or more of voting stock. Holdings below the 10 percent threshold are considered portfolio investments and are usually passive investments by households. China still highly restricts such investments.
2 See China State Council (2006).
3 See National Science Foundation data on the global share of high-technology manufacturing value added over 1990-2014. China’s figures include production in Hong Kong. High-technology manufacturing includes aerospace, communications and semiconductors, computers and office machinery, pharmaceuticals, and scientific instruments and measuring equipment.
4 Western Europe includes Austria, Belgium-Luxembourg, Denmark, Finland, France, Germany, Greece, Ireland, Italy, Netherlands, Norway, Portugal, Spain, Sweden, Switzerland and United Kingdom.
5 The greatest sources of U.S. inward FDI are Western Europe and Japan, not China. Similarly, very little of U.S. outward FDI is directed to China; the majority is invested in Western Europe and Japan.
References
China Ministry of Commerce. 2003-2015. China Commerce Yearbook. www.yearbook.org.cn
China National Bureau of Statistics. 1990-2012. China Statistical Yearbook. www.stats.gov.cn
China State Council. 2006. The National Medium- and Long-Term Program for Science and Technology Development (2006-2020): An Outline. www.gov.cn
Holmes, Thomas, J., Ellen R. McGrattan and Edward C. Prescott. 2015a. Quid Pro Quo: Technology Capital Transfers for Market Access in China. Review of Economic Studies 82 (3): 1154-93.
Holmes, Thomas, J., Ellen R. McGrattan and Edward C. Prescott. 2015b. The Costs of Quid Pro Quo. Economic Policy Paper 15-01, Federal Reserve Bank of Minneapolis. www.minneapolisfed.org
National Science Foundation. 2012, 2016. Science & Engineering Indicators. www.nsf.gov
Sutherland, Dylan, and Ben Matthews. 2009. “Round Tripping” or “Capital Augmenting” OFDI? Chinese Outward Investment and the Caribbean Tax Havens. Working Paper, University of Nottingham.
Xiao, Geng. 2004. People’s Republic of China’s Round-Tripping FDI: Scale, Causes and Implications. Discussion Paper 7, ADB Institute.