Authors


Mortgage data collected annually under the Home Mortgage Disclosure Act (HMDA) provide the only comprehensive picture of the rates at which U.S. consumers’ requests for home mortgages are approved and denied. The HMDA data have long shown significant gaps in mortgage denial rates along racial and ethnic lines. Since the housing market crash of 2007–2008, however, a new denial rate gap—between rural and urban loan applicants—has emerged in the Ninth Federal Reserve District and some other regions. This new gap is relevant to the Community Reinvestment Act,1 which provides special consideration for the many rural counties designated as disadvantaged or underserved.
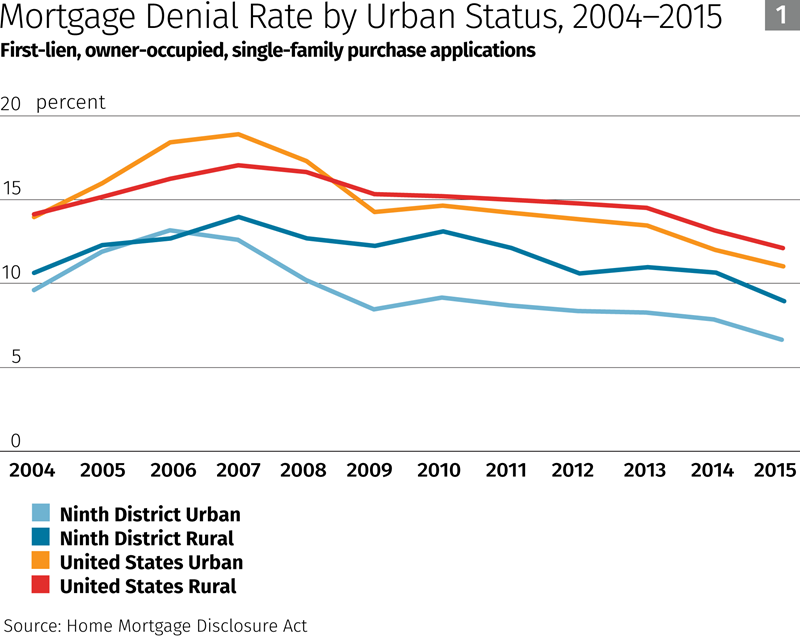
Figure 1 shows Ninth District and national trends since 2004 in rural and urban denial rates2 for applications for mortgages used to purchase a home3 (i.e., excluding mortgage refinancings and home improvement loans). From 2004 to 2007, as the housing boom crested, denial rates in rural and urban areas trended up. During this period, the rural-urban differences in denial rates were small, with rural denial rates slightly higher than urban rates in the Ninth District and the opposite nationally. Starting in 2008, denial rates in urban areas fell quickly, about back to their 2004 levels, while rural denial rates fell much less. As a result, rural denial rates from 2008 through 2015 became distinctly higher than urban rates in the Ninth District and somewhat higher than urban rates nationally as well.
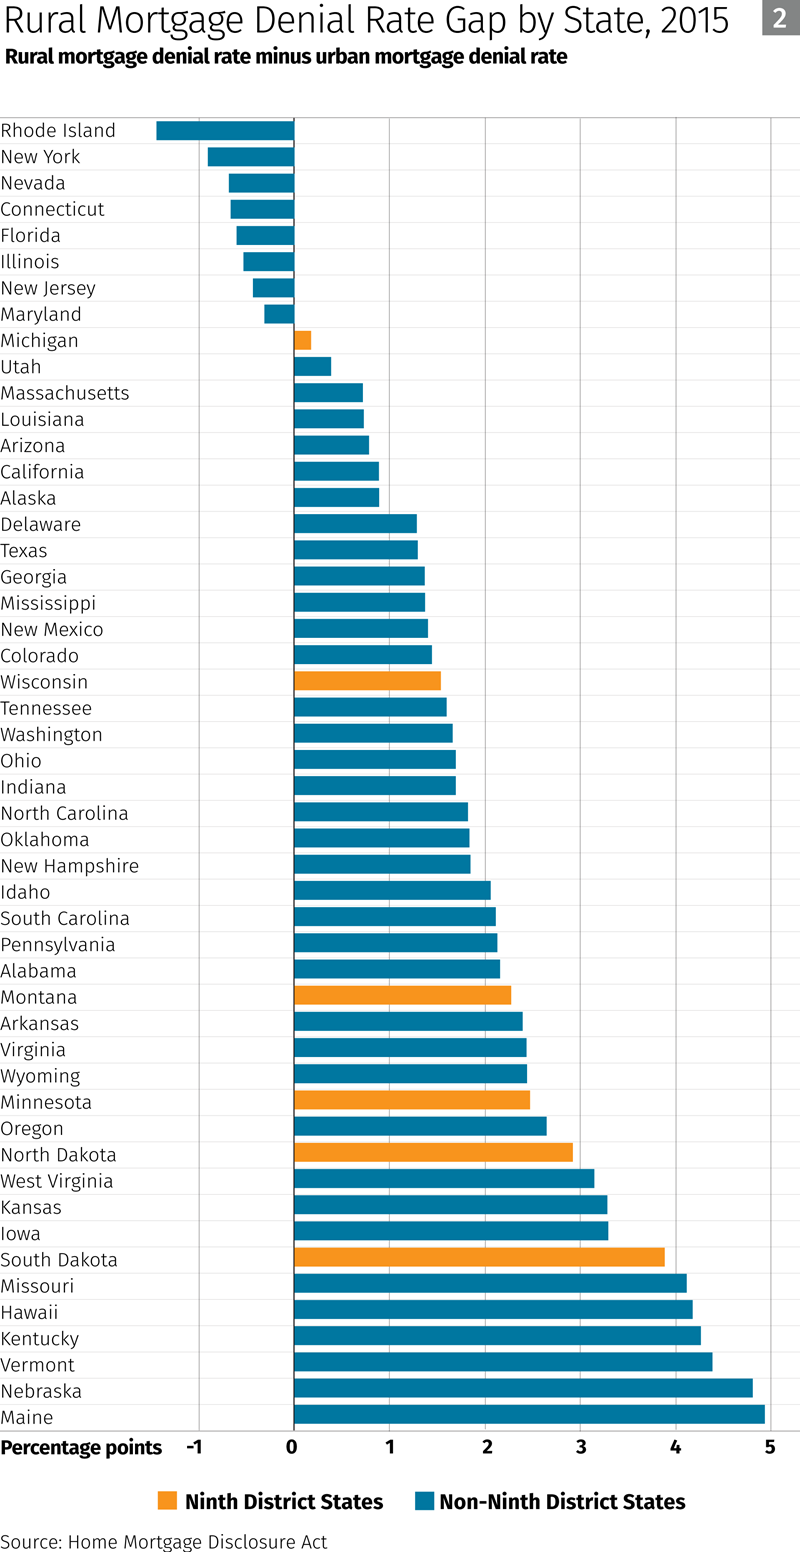
Figure 2 shows that, in 2015, rural denial rates exceeded urban denial rates in all but eight states. However, some of the eight states are very populous (for example, Illinois, New York, and Florida), and other very populous states such as Michigan, California, and Texas have only small rural-urban denial rate gaps. This explains why the national rural-urban denial rate gap is small, just 1.1 percentage points. By contrast, the 13 states with the highest gaps—ranging from 2.5 percentage points in Minnesota to 5 percentage points in Maine—generally have small to average populations. Three Ninth District states —North Dakota, Minnesota, and South Dakota—are in the group of 13 states with the largest rural-urban denial rate gaps.
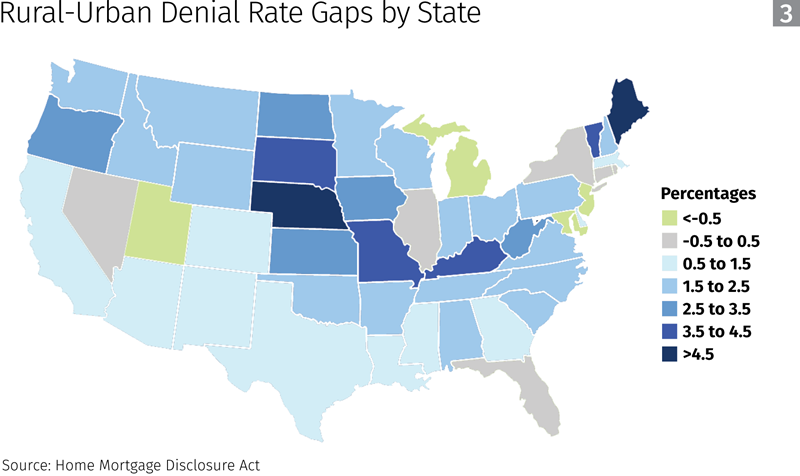
Figure 3 shows that states with relatively high rural-urban denial rate gaps are spatially clustered, to some extent, in the Great Plains and northern New England. However, other states with large gaps, such as Kentucky, West Virginia, Oregon, and Hawaii (which, along with Alaska, was included in our analysis but is not mapped here), can be found in other regions.
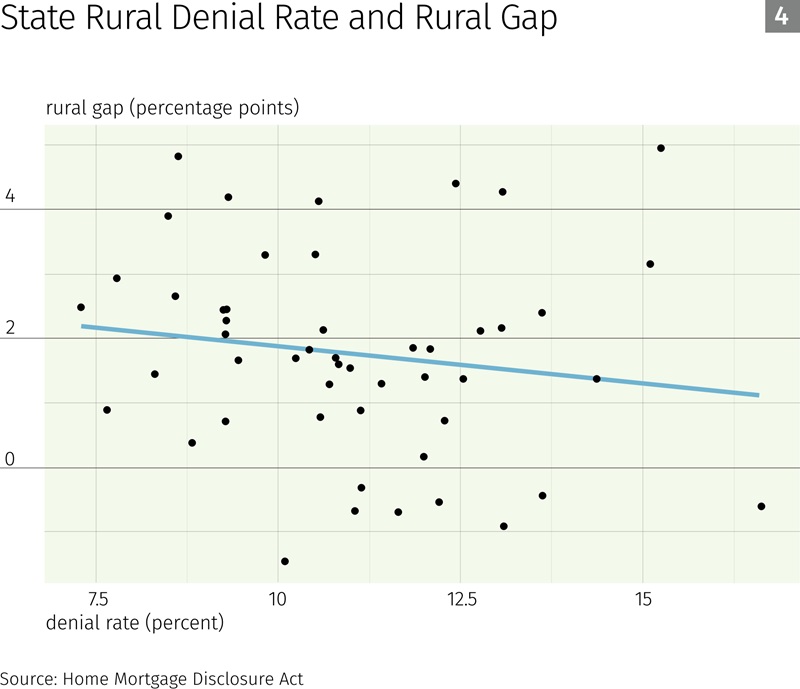
One might conjecture that high rural-urban mortgage denial rate gaps are driven by high levels of mortgage denial rates in rural areas. In fact, however, a state’s rural-urban denial rate gap is not closely related to the level of its rural denial rate. Figure 4 compares states’ rural denial rates (on the horizontal axis) to their rural denial rate gaps (vertical axis). The dots scatter widely, with no strong pattern. (Technically, this pattern produces a small but statistically insignificant correlation coefficient of -0.15.)
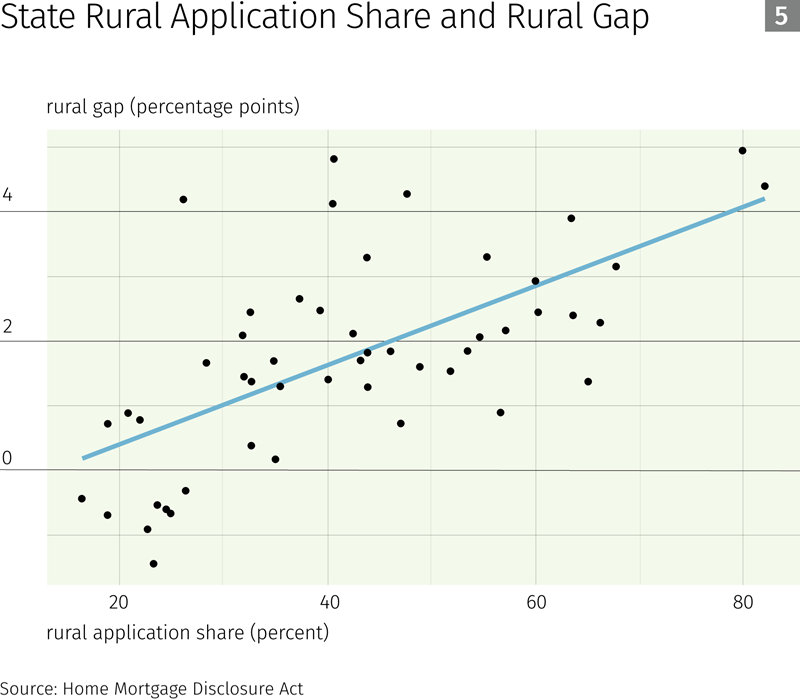
A clearer pattern emerges in Figure 5, where we compare states’ denial rate gaps to their rurality, as measured by the percentage of mortgage applications occurring in rural areas. A clear majority of the rural-urban denial rate gaps that exceed the national average gap of 1.1 percent are in states where the rural share of mortgage applications is above the national average rural share of 33.6 percent. The upward sloping blue line summarizes this pattern and reflects a strong and statistically significant correlation of 0.64 between rural application share and rural-urban denial rate gaps. Notwithstanding this pattern, we are not able, at this time, to explain why the rural-urban denial rate gap has widened in the Ninth District and other areas since 2008.
Endnotes
1 The Community Reinvestment Act, or CRA, is a federal law that encourages banks to help meet the credit needs of the communities in which they operate, including low- and moderate-income neighborhoods. For more on the CRA, see our CRA Resources page.
2 HMDA data are reported, spatially, by Census tract, so we define our rural and urban areas by classifying Census tracts. To that end, we compare the land area overlap of 2010 Census Bureau “urban areas” to Census tracts for both 2000 (used for the 2004–2011 HMDA data) and 2010 (used for the 2012–2015 HMDA data). If a tract’s area is primarily within the boundaries of an urban area or areas, we classify the entire tract as urban. Otherwise the tract is classified as rural. Note that this method leads to some discrepancies between the areas we classify as urban and the 2010 Census urban areas, because tracts do not nest perfectly within urban area designations. We note that not all mortgage lenders are subject to HMDA’s data reporting requirements. As a result, the HMDA data we use cover only an estimated 90 percent of all mortgage applications in the United States. Furthermore, since the exemptions from HMDA data reporting focus on small lenders with no activity in urban areas, the data probably cover a somewhat smaller percentage of rural than urban applications.
3 We consider only applications for first lien mortgages used to purchase an owner-occupied, single-family (one- to four-unit) home.