Authors

Kevin Johnson
Data Analyst

American Indian and Alaska Native (AIAN) home buyers living on or near federally recognized Indian reservations rely heavily on loans secured by manufactured homes, according to data collected under the Home Mortgage Disclosure Act (HMDA).1 The HMDA data also imply that in 2016 this loan market remained highly concentrated, despite controversy associated with the two dominant lenders.
AIAN Home Buyers On and Near Reservations Rely Heavily on Manufactured-Home Loans
Nationwide, as shown in Table 1, manufactured-home loans accounted for just 2.7 percent of all home purchase loans reported under HMDA in 2016.2 On Census tracts that overlap reservations, however, 9.8 percent of all HMDA-reported home purchase loans were for manufactured housing.3 This partly reflects the fact that many American Indian reservations are located in rural areas, where manufactured homes are more common.4
Moreover, reliance on manufactured-home loans jumps further when we look at just AIAN home buyers in Census tracts that overlap reservations. This group of home buyers is small by national standards, accounting for just 1,214 home purchase loan applications and 559 home purchase loan originations in the 2016 HMDA data. However, 39.5 percent of their home purchase mortgage originations were for a manufactured home, roughly 4 times the overall rate in these Census tracts. Looking only at Census tracts that lie mostly on reservation land, we see that AIAN reliance on manufactured home purchase loans was even higher, at 49.1 percent.5
The percentages rise further if we look at applications instead of loans.6 Requests for manufactured-home loans made up 63.6 percent of all home purchase loan applications by AIAN applicants in the 2016 HMDA data in all Census tracts overlapping reservations and 75.8 percent in the Census tracts mostly on reservations.
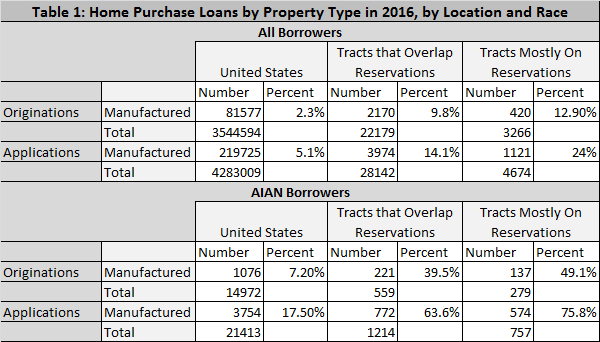
Geographically, the use of manufactured-home loans by reservation-area AIAN home buyers is especially significant in the Southwest, as shown in Figure 1. However, tracts where 40 percent or more of AIAN home purchase loans are for a manufactured home are scattered across Indian Country.
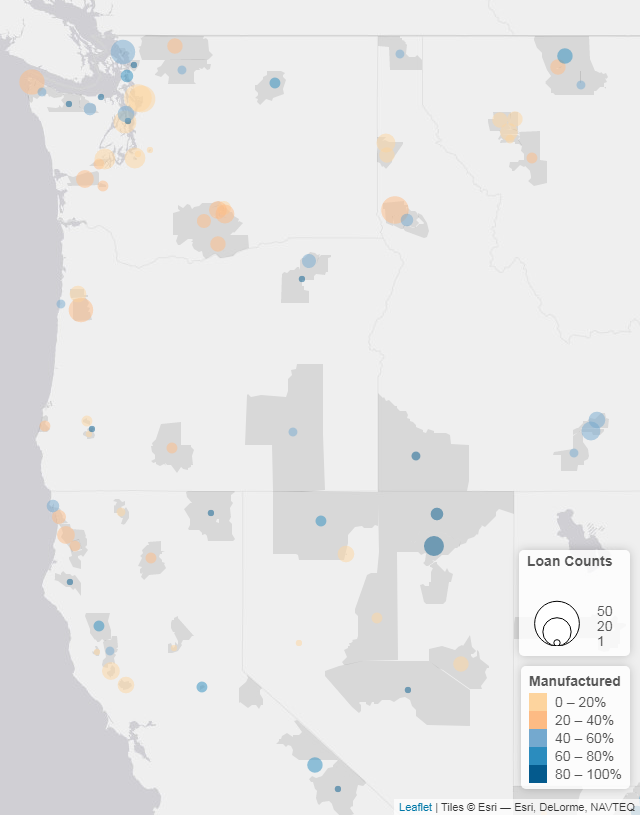
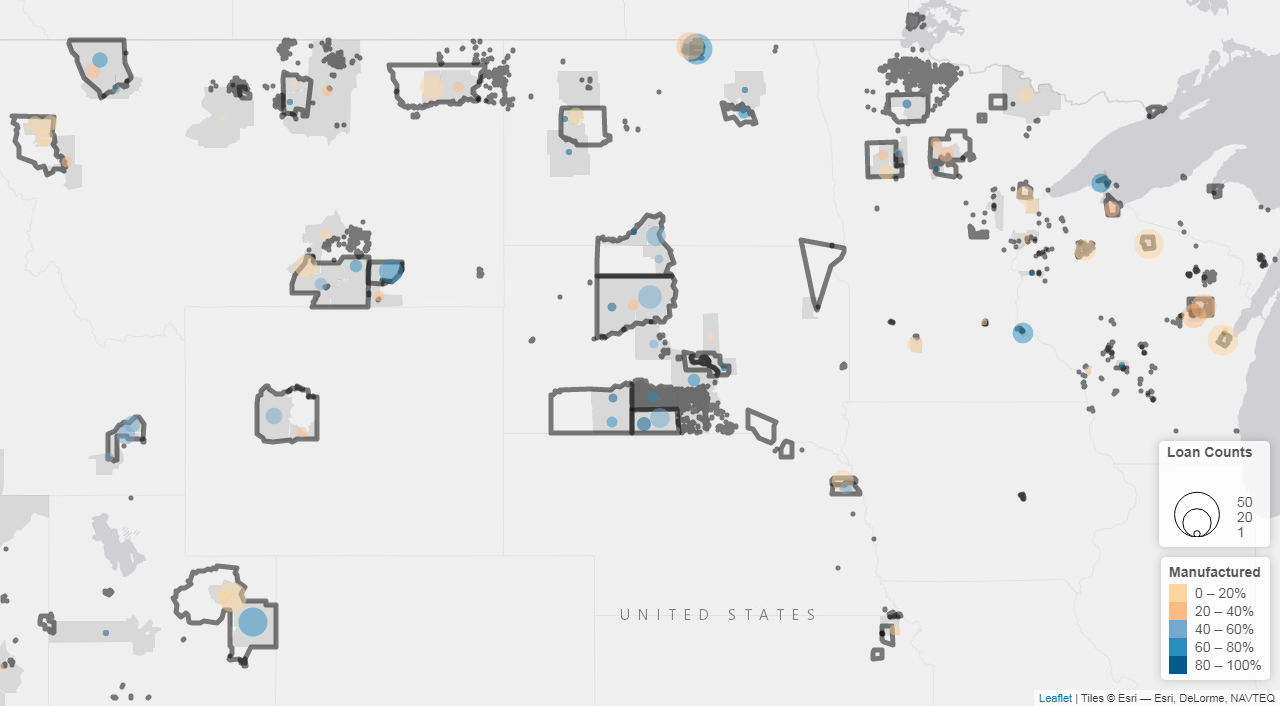
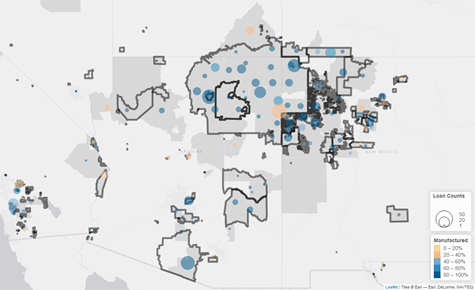
(See map insets for larger images of the Southwest, Northwest, and Northern Plains/Midwest.)
A Few Lenders Have Dominated This Market
The market for manufactured-home loans has been moderately concentrated among lenders in recent years. According to nationwide HMDA data for 2012-2015, the top 4 lenders accounted for 48 percent of all manufactured-home loans originated, with the top 2 alone accounting for 38 percent.7 Moreover, among AIAN borrowers in Census tracts that overlap reservations, the concentration levels were notably higher. The top 4 lenders in this AIAN market in 2012-2015 made almost 79 percent of the loans, and the top two—Vanderbilt Mortgage and Finance (VMF) and 21st Mortgage (TFM)—held 65 percent of the total market (Table 2). For applications, including those denied by the lender or not accepted by the applicant, the shares of the top 4 and top 2 lenders in this market in 2012-2015 were even higher, at 89 and 80 percent, respectively.
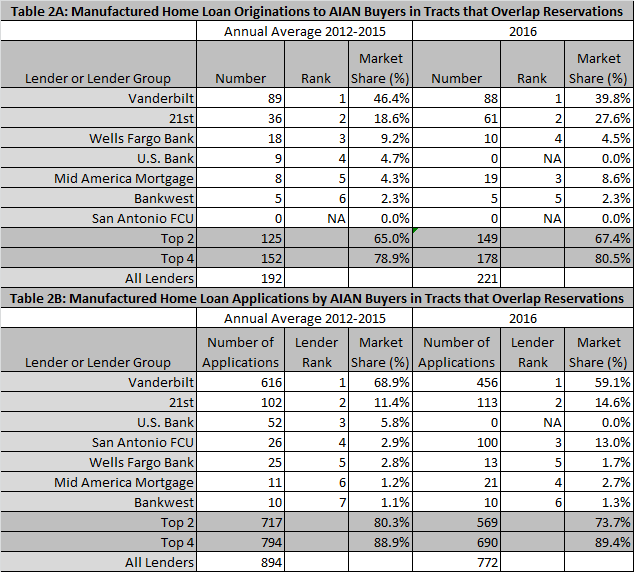
The high share held by VMF and TFM is noteworthy for two additional reasons. First, both companies are owned by Clayton Homes, which “manufactures, sells, finances, leases and insures homes for people throughout the United States.”8 From that perspective, a single firm, Clayton, owned at least a 67 percent share of this market in 2012-2015. Second, VMF and TFM have been involved in a contentious public discussion following a December 2015 article in the Seattle Times critical of their treatment of AIAN borrowers.9
Market Shares Did Not Change Much in 2016
The HMDA data for 2016 (the year after the Seattle Times story), show at most small changes in the degree of market concentration. Among HMDA-reported AIAN borrowers in Census tracts that overlap reservations, the combined VMF and TFM share rose slightly to 67 percent of loans originated, which helped lift the top 4 share to 80 percent. By contrast, the combined VMF and TFM share of loan applications fell to 74 percent while the top 4 share held at about 89 percent. The fact that the top two lenders’ share of originations ticked up as their share of applications slipped is partly due to activity at San Antonio Federal Credit Union, or Credit Human.10 Applications to this lender hit 100 in 2016 (well above its 2012-2015 average of 26) but yielded no originations. (Ninety-eight were denied by the lender and 2 were not accepted by the borrower.) Figure 2 summarizes how applications for manufactured-home loans by AIAN borrowers in Census tracts overlapping reservations were distributed among types of lenders and selected individual lenders from 2012 to 2016.
![]()
In short, HMDA data show that AIAN home buyers on and near American Indian reservations rely heavily on manufactured-home loans and that Vanderbilt Mortgage and Finance and 21st Mortgage, both owned by Clayton Homes, continue to hold a very high share of the market for these mortgages, despite controversy over their lending practices.
Endnotes
1 The definition of manufactured home used in reporting HMDA data relies on the federal building code for factory-built housing established by the Department of Housing and Urban Development (HUD). The HUD code requires generally that manufactured housing be essentially ready for occupancy upon leaving the factory, which, for example, excludes homes assembled on site from pre-fabricated panels. HMDA rules also exclude recreational vehicles such as boats or campers, which are not considered as dwellings for purposes of HMDA.
2 The loan records we analyze are limited to applications for first-lien mortgages for the purpose of purchasing a property intended to be owner-occupied. Sole applicants were designated AIAN if they were identified racially as either AIAN only or AIAN and White. Applications with co-applicants were designated as AIAN if both the applicant and co-applicant were identified as either AIAN only or AIAN and White.
3 We identify a Census tract as overlapping a reservation if at least one of the housing units in the tract is on reservation land, according to 2010 Census data. We also refer to these tracts, and homes or people in these tracts, as “on or near” reservations.
4 See Dyar, W., Lim, J., and Skidmore, M. (forthcoming). “Manufactured Home Living across Rural America.” In D. Albrecht, S. Loveridge, S. Goetz, and R. Welborn (eds.), Rural Housing and Economic Development (pp. 172-189). Taylor and Francis, New York, NY.
5 We identify a Census tract as mostly on a reservation if at least 90 percent of the tract’s housing units were on reservation land, according to 2010 Census data. Note that the tracts we identify as mostly on a reservation are included in (i.e., are a subset of) the tracts we identify as overlapping a reservation.
6 Our count of applications includes only denial relevant applications, by which we mean loan applications whose outcomes make them relevant for inclusion in a standard calculation of the percentage of applications denied. This includes applications resulting in a loan origination, applications approved by the lender but not accepted by the applicant, and applications denied by the lender. All other applications are excluded from the analysis here.
7 The 4-firm concentration ratio of 48 percent that we tabulate for manufactured housing loans in the 2012-2015 HMDA data is only slightly higher than the overall ratios of 44 percent for real estate credit and 46 percent for mortgage bankers and loan correspondents that the U.S. Census tabulated based on firm revenues in 2012, but all three of these ratios are in the top half of the ratios the Census Bureau reports for the industries within the financial sector as of 2012. For the 2012 Census figures, see factfinder.census.gov/faces/tableservices/jsf/pages/productview.xhtml?pid=ECN_2007_US_52SSSZ6&prodType=table.
8 See www.claytonhomes.com/family-of-brands.
9 For the original article by Mike Baker of the Seattle Times and Doug Wagner of BuzzFeed, see seattletimes.com/seattle-news/times-watchdog/minorities-exploited-by-warren-buffetts-mobile-home-empire-clayton-homes/. A rebuttal for Clayton Homes and a reply by Baker and Wagner are at, respectively, www.businesswire.com/news/home/20151226005004/en/Reporting-Mischaracterizes-Clayton-Homes%E2%80%99-Treatment-Customers-Employees and www.seattletimes.com/seattle-news/times-watchdog/seattle-times-responds-to-clayton-homes-claims-about-mobile-home-investigation/.
10 This lender’s name was changed during 2016, to Credit Human.