Authors


Kevin Johnson
Data Analyst

The publicly available data collected under the Home Mortgage Disclosure Act (HMDA) provide a broad view of American home lending.1 They also are especially important for their coverage of applications (not just loans made) and outcomes by race. In this article, we analyze HMDA data from 2004 to 2016 on applications to purchase a home on or near a federally recognized American Indian reservation,2 with an emphasis on loans to purchase manufactured homes.3
We find that, compared to other borrowers, American Indian and Alaska Native (AIAN) borrowers more often apply for manufactured-home loans, and this tendency is stronger in census tracts with a higher share of housing units on reservation land. We surmise that these patterns may be partly related to the trust status that encumbers much reservation land. For a number of reasons, these differences merit attention, including that interest and denial rates on manufactured-home loans are significantly higher than on site-built-home loans.
Organizing HMDA Data for Analysis of Home Loans on Reservations
In the HMDA data, census tracts provide the most precise information about the location of the property being financed. However, in Indian Country, because many census tracts are partly on and partly off of reservations, HMDA’s reliance on census tracts for location makes it impossible to precisely count the number of applications or loans for properties on reservations. In addition, the HMDA data provide no direct information on whether properties are on trust land or not. They also do not distinguish between manufactured homes attached to real estate and financed via a mortgage and those financed via a chattel, or personal property, loan secured only by the home itself.
Figure 1 displays a fact we make use of—the census tracts that overlap reservations range widely in the percentage of their housing units that are on reservation land. The largest group of overlapping tracts has only a small percentage of housing units on reservation land. The next-largest group of overlapping tracts is very different, having all or nearly all of its housing units on reservation land. Relatively few overlapping tracts have a more even mixture of housing units on and off of reservation land. We refer to tracts with more than 0 percent but less than 10 percent housing unit overlap with reservations as “mostly off” reservations and to tracts with 90-to-100 percent housing unit overlap as “mostly on” reservations.
This distinction is helpful because mortgages and other home loans are secured by houses. So if most of the houses in a tract are outside the reservation, it is likely that most of the home loans used to buy houses in that tract are secured by properties outside the reservation. Similarly, if most of a tract’s houses are inside the reservation, it is likely that most home loans in that tract are secured by homes inside the reservation. Thus, when we compare HMDA results for a tract mostly off of reservation land with HMDA results for a tract mostly on reservation land, we can be reasonably confident that the home loans in mostly off-reservation tracts rarely involve trust land, whereas the home loans in tracts mostly on reservations might involve trust land, especially if one or more of the borrowers is AIAN.4 We present our results for both of these groups of tracts, as well as for other census tracts that overlap reservations, to contrast the differences between areas where trust land can be an issue and areas where it is of very limited significance.5
Figure 1: 2010 Census Tracts by Share of Housing Units on a Reservation

Figure 2 maps the reservations and 2010 census tracts analyzed here.6 The blue lines show reservation boundaries.7 Any tract with at least one denial-relevant8 HMDA loan application of an AIAN borrower in 2012–2016 is colored orange. For tracts not entirely inside a reservation, the location of loans is not specifically identifiable because HMDA data do not distinguish between the off-reservation and on-reservation part of the tract.9
Figure 2: Included Reservations and Tracts

Results: Reservation Location Is Associated with Loan Type, but Only for AIAN Borrowers
Figure 3 presents our key findings: Compared to other borrowers, AIAN borrowers more often apply for manufactured-home loans, and this tendency is stronger in census tracts with a higher share of housing units on reservation land. Specifically, during 2012–2106, the percentage of AIAN manufactured-home loan applications averaged about 30 percent in the mostly off-reservation tracts but over 75 percent in the mostly on-reservation tracts.10,11 The corresponding percentages for all other races, shown in the bottom panel of Figure 3, are dominated by non-Hispanic white applicants. These percentages are lower—about 10 to 15 percent—and differ little between tracts mostly off and mostly on reservations.
Why does the type of loan requested vary so much with location for AIAN borrowers and so little for other borrowers? While our analysis does not provide a firm answer, the following facts about land and borrowing in Indian Country lead us to suggest that trust land may be one factor:
- AIAN applicants have the unique privilege of locating homes on reservation trust land, compared to other borrowers, who generally buy homes on fee-simple land.
- Obtaining a mortgage for property on fee land is simpler than obtaining a mortgage on trust land.12
- For that reason, homes on trust land are more likely to be financed with a chattel loan, as compare to homes on fee land, other things being equal.
- Manufactured homes, being easier to move and therefore easier to repossess, make more suitable collateral for chattel loans than site-built homes, which are almost always financed with a mortgage.
Figure 3: Manufactured-Home Share of Loan Applications by Race and Tract Overlap
A: American Indian and Alaska Native

B. All Other Races

Taken together, these facts suggest that the presence of trust land on reservations could be one reason that AIAN borrowers, but not other borrowers, disproportionately apply for manufactured-home loans, especially in tracts mostly on reservations.13
The high rate of manufactured-home loan applications by AIAN applicants in tracts mostly on reservations is associated with outcomes that are problematic for the applicants.14 For example, Figure 4 shows a big difference in the denial rate (that is, the percentage of applications turned down by the lender) on loan applications for site-built versus manufactured homes. The denial rate for AIAN manufactured-home loan applications reached about 75 percent in tracts mostly on reservations in 2015–2016, compared to about 25 percent for site-built home loan applications there. The difference is less extreme but still large in tracts mostly off of reservations. High denial rates on manufactured-home loans prevail in many tribal areas across the country, as shown in Figure 5. However, there is an especially strong regional cluster of elevated denial rates on manufactured-home loan applications in the Four Corners area of the Southwest.
In addition, HMDA data show that loans to purchase manufactured homes are much more likely to be high-priced, and by a higher margin, than mortgages on site-built homes.15 This can significantly erode or even reverse the cost advantage that otherwise accrues to manufactured-home ownership.
The tendency to finance manufactured homes with chattel loans is one factor underlying the higher interest rates on manufactured-home loans. The Consumer Financial Protection Bureau estimated that the annual percentage rate on new manufactured-home loans was about 1.5 percentage points higher for chattel loans than for mortgages,16 or over $60 per month of extra interest in the first year of a loan to buy a small manufactured home.17 A factor that may contribute to this difference is the very limited secondary market in manufactured-home chattel loans that has prevailed since Fannie Mae and Freddie Mac curtailed their purchases in the wake of high defaults in the late 1990s.
For now, we primarily document the patterns discussed here. We hope this information will lead to further study of the reasons behind them and their implications.
Figure 4: AIAN Loan-Denial Rates by Property Type and Tract Overlap Category
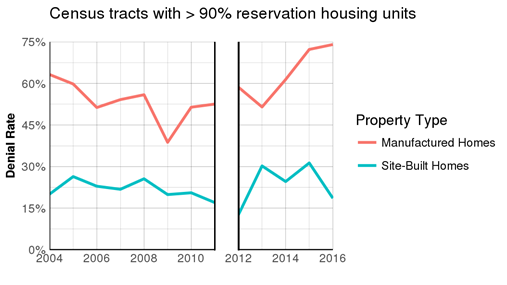

Note: We insert a break in the figures between 2011 and 2012 because the basis for reporting HMDA data changed from tracts used in the 2000 census before 2012 to tracts used in the 2010 census in and after 2012.
Figure 5: Denial Rates on Manufactured-Home Loan Applications in Tracts Overlapping Reservations
(Bubble areas are proportional to the number of denial-relevant applications)

Endnotes
1 See Neil Bhutta, Steven Laufer, and Daniel R. Ringo (November 2017), “Residential Mortgage Lending in 2016: Evidence from the Home Mortgage Disclosure Act Data,” Federal Reserve Bulletin.
2 Our analysis covers only loan applications for owner-occupant first-lien loans. Unless otherwise noted, the figures shown and discussed here are based on HMDA-reported applications or loans for owner-occupied, first-lien, home-purchase mortgages, on both one-to-four-unit properties and manufactured homes. We adopt the practice, which is common in discussions of HMDA data, of referring to one-to-four-unit properties as “single-family homes.” We also assume that properties reported in HMDA as anything other than manufactured home are site-built (constructed or assembled on site). This includes properties reported as one-to-four unit structures.
3 A manufactured home is defined by HUD as a home that is ready to live in when it leaves the factory. The definition excludes homes that are assembled on site using manufactured panels, etc. In the HMDA data, loans on manufactured homes may be either true mortgages secured by both the land and housing unit on the land, or, probably more often, nonmortgage loans secured by the unit alone.
4 If we had comprehensive and reliable data on trust land by reservation, we could have used that information to enhance our analysis, but such data were not readily available to us.
5 When computing ratios, such as in Figures 3 and 4, we have to exclude tracts where there were no loan applications.
6 For detailed maps of the tracts that overlap many individual reservations, see the CICD’s Reservation Profiles.
7 Including off-reservation trust land.
8 By “denial-relevant” applications, we mean applications whose outcome is either a loan, a denial of the application by the lender, or an approval of the application by the lender followed by non-acceptance of the offered loan by the borrower. Hereafter, unless otherwise noted, we will use “application” and “denial-relevant application” interchangeably. We ignore applications that result in other outcomes, such as applications withdrawn by the borrower or incomplete applications.
9 In addition, while the map shows geographic or land area overlap, our subsequent analysis is based on the degree of overlap in housing units. Because homes are sometimes tightly clustered in towns or other small areas, the overlap seen in Figure 2 may not be a good guide to the degree of housing-unit overlap. Also, many reservation areas, and sometimes whole reservations, lie in census tracts with no reported AIAN loan applications during 2012–2016.
10 These percentages are computed for census tracts overlapping reservations by dividing the number of manufactured-home loan applications by the number of manufactured-home plus site-built-home applications, for AIAN applicants and also for all other applicants.
11 The share of AIAN applications for manufactured-home loans is somewhat lower in 2004–2011, but the pattern of differences by location and race is similar.
12 For further information, see the Tribal Leaders Handbook on Homeownership.
13 Other factors, such as lower incomes or credit scores in the AIAN population in many tribal areas, could also contribute to the higher usage of manufactured-home loans by AIAN applicants. To the extent that these factors also vary systematically between tracts mostly off and tracts mostly on reservations, they could also explain the especially high usage of manufactured-home loans by AIAN borrowers in tracts mostly on reservations. For some evidence that borrowers within reservations are less creditworthy than borrowers living nearby but outside reservations (but with no data on race), see Valentina P. Dimitrova-Grajzl, Peter Grajzl, A. Joseph Guse, and Richard M. Todd (March 26, 2014), “Consumer Credit on American Indian Reservations,” available at SSRN: https://ssrn.com/abstract=2408747 or http://dx.doi.org/10.2139/ssrn.2408747. Regional differences may also play a role. Our Figure 5 shows that manufactured-home loan applications are especially common in Arizona and New Mexico, where Dimitrova-Grajzl et al. show that credit scores within reservations are relatively low. Further analysis would be needed to determine the relative importance of the trust land factors stressed here and other factors. The inclusion of important additional factors in the HMDA data collected in and after 2018 will facilitate this type of analysis in the future.
14 These associations may also reflect the additional factors discussed in footnote 13.
15 Consumer Financial Protection Bureau (CFPB) (2014), Manufactured Housing Consumer Finance in the United States, pp. 32–34; Government Accountability Office (2014), Manufactured Housing: Efforts Needed to Enhance Program Effectiveness and Ensure Funding Stability, p. 18. However, after the Consumer Financial Protection Bureau implemented its final rule on high-priced chattel loans in January 2014—defining “high-cost” less stringently than for fee-simple transactions—the proportion of chattel loans classified as high-cost has dropped significantly
16 CFPB (2014), Manufactured Housing Consumer Finance in the United States, p. 36 (based on proprietary data). The difference was partly offset by lower fees and may have reflected the smaller size of the chattel loans (since they did not include the cost of land).
17 Assuming a $70,000 purchase price for an installed single-section manufactured home financed with a chattel loan with a $10,000 down payment.