Author


Since the close of the Great Recession, a lot of time, tears, and ink have been spent on the plight and path of jobs and workers—the lifeblood and financial well-being of most households. But with unemployment near record lows, now’s a good time to also check on the health and trends of new business development—the goose that lays all of those golden job eggs.
It’s long been held that small business is the lifeblood of the economy. That’s not false, but it might be more accurate to say that new businesses—typically small by necessity—are central to job growth. That’s because young businesses tend to be the companies that grow, bringing not only new products, services, and competition to the economy, but significant job growth.
Measuring new business creation, and the entrepreneurial stream that feeds it, isn’t as straightforward as counting jobs. That’s because there are different types of businesses and business ownership structures. Even defining when an entity is a “real” business is not as straightforward as it might seem: Once it is registered with the state? When it earns its first dollar? Or maybe when it employs its first worker?
Suffice it to say, there are different ways to measure new business activity, and most of them have some unique insights to offer. But available data suggest that the Ninth District has seen steady and positive growth in new businesses during the recovery, and survival rates of new businesses have remained fairly stable. The less-good news: It’s been a bit lumpy, with some district states faring better than others. Maybe more notable, the positive growth in business creation of late has not been as much of a boon to new employment as one would expect.
First, some paperwork
The first, easiest place to start talking about new business trends is with establishments, which are defined as business locations with at least one paid employee. (And now a methodological caveat: Establishments comprise all unique locations, including those of an existing parent or franchise firm, like a fast-food restaurant; as such, establishment data represent business locations, but not necessarily startup activity in a purely entrepreneurial sense. The extent of mingling of different types of new establishments is outside the scope of this article. All establishment data discussed here come from the Business Employment Dynamics series put out by the Bureau of Labor Statistics.)
Much like the nation as a whole, Ninth District states have seen steady, moderate growth of total establishments during the economic recovery (Chart 1)—a trend that generally bodes well for the economy and for workers. During the recovery, the district’s establishment growth rate has lagged the national average but, since 2001, the trend favors district states slightly, mostly because the Great Recession affected national establishments much more negatively.
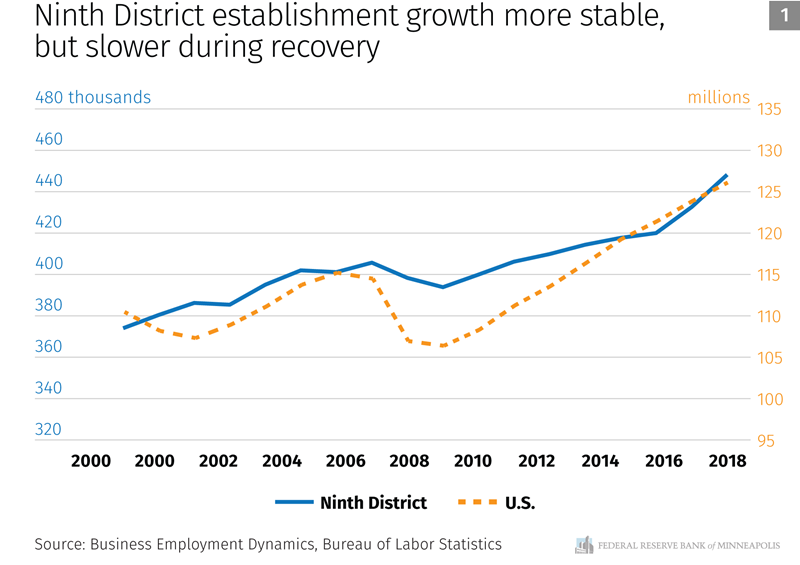
Some district states have fared better than others. Montana and North Dakota, for example, have seen stronger establishment growth during the recovery than the nation or other districts states.
There’s also more to this trend than meets the eye. For starters, there is a lot of churn below the surface; the net growth of establishments smooths over the many births and deaths of companies that occur every day in the economy (Chart 2). Births of new establishments have been consistently outnumbering deaths in recent years. The district’s churn rate has also grown, with the number of both births and deaths slowly increasing, though that’s not unexpected given a growing economy and pool of total businesses.
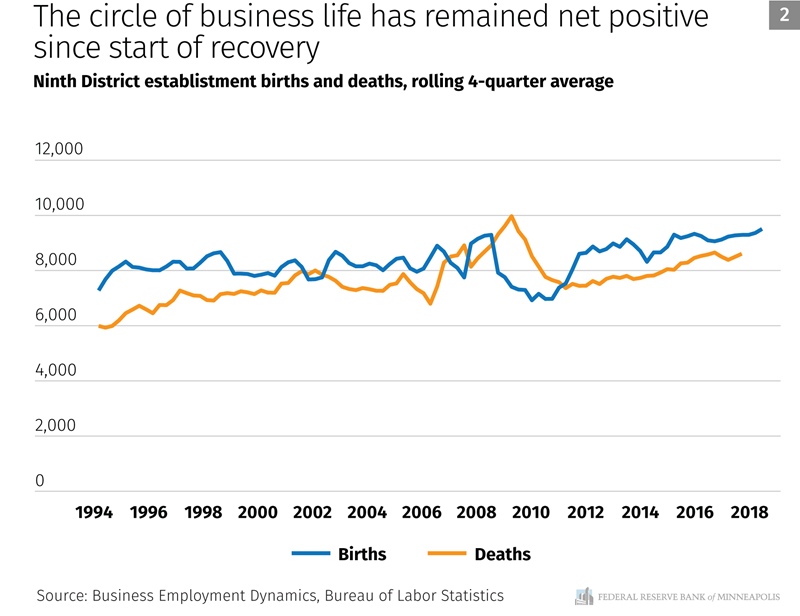
Establishment births in Ninth District states have been playing a bit of catch-up after a sluggish fertility period leading into the Great Recession, followed by a notable bout of chastity. But during the recovery, there has been a substantial uptick, partly due to the breakneck activity in the Bakken oil-producing region in western North Dakota during the first half of this decade. Between 2009 and 2012, the establishment birth rate in the Peace Garden State roughly doubled, as did its share of all establishment births (to about 11 percent) among district states.
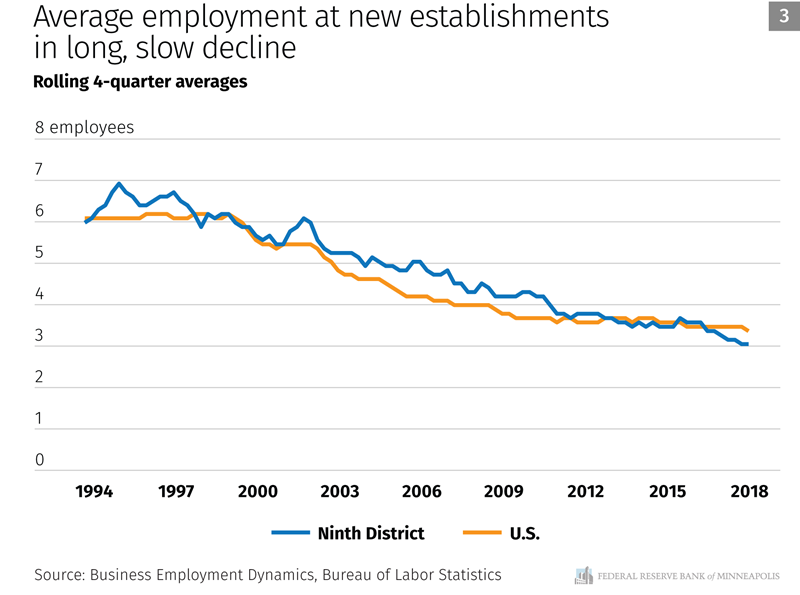
But the uptick in birth rates has not been a boon to employment. In fact, total and average employment from new establishments have declined steadily, a trend that dates back to at least the 1990s. In 1995, for example, more than 32,000 new establishments were created in district states, and they employed about 206,000 workers (6.4 workers per establishment). Over the most recent four quarters (ending second quarter of 2018), 38,000 new district establishments employed just 118,000 (3.1 per establishment). Individual district states are seeing slight variations of this employment trend, but the overall downward pattern is the same, as it is nationwide (Chart 3).
Fortunately, average survival rates of new establishments appear to have generally held steady. In Minnesota, for example, the likelihood of a new establishment still being in business five years later has generally held between 50 percent and 60 percent for much of the past 25 years, with the notable exception of the Great Recession, when survival rates briefly plunged to 44 percent (Chart 4). Average employment at surviving establishments is higher than at new establishments (as one might expect). But over time, surviving establishments have seen a similar, though smaller, drop in average employment size.
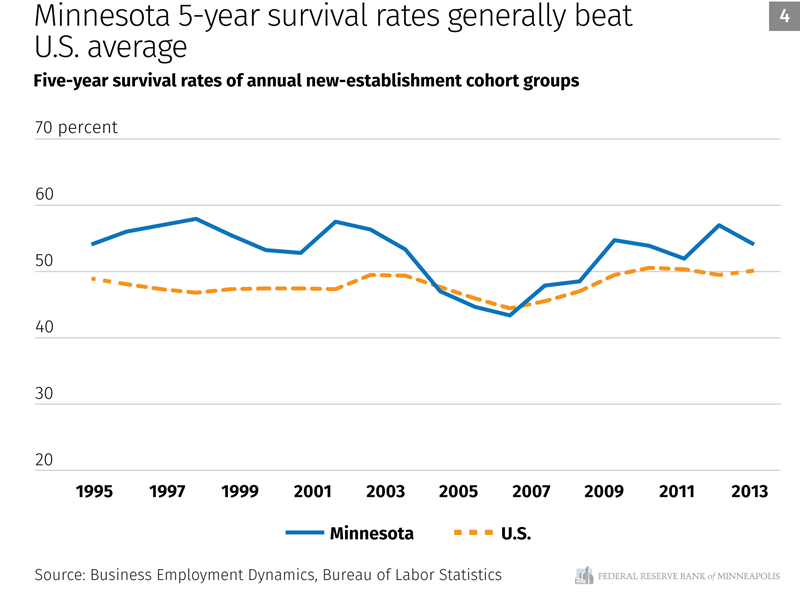
Whether that’s good news or bad news is a glass-half-full kind of question: While average employment of new and surviving firms has dropped, the rate of employment growth among surviving firms is higher. In the last half of the 1990s, the average new establishment in Minnesota employed roughly eight workers in its first year; if it survived for five years, it employed about 12 workers. By 2013, new establishments in Minnesota employed only about five workers in the first year, but survivors employed nine workers. So total job levels are lower, but growth rates among survivors are faster.
This falling employment trend likely has many explanations. Technology, for example, has slowly lessened the need for certain positions (like secretaries) at small firms over time and has made other tasks—bookkeeping, inventory and human resource management, delivery, even sales—easier to outsource or handle with fewer employees. Automation, technology’s offspring, puts constant downward pressure on labor needs at everything from manufacturing plants to retail stores.
Mustapha Hammida, an economist with the Minnesota Department of Employment and Economic Development, also pointed out that total employment at young establishments has fallen across all size categories; however, it has fallen most steeply among larger new establishments (Chart 5). “It shows that new businesses have been moving away from the large-size classes,” Hammida said.
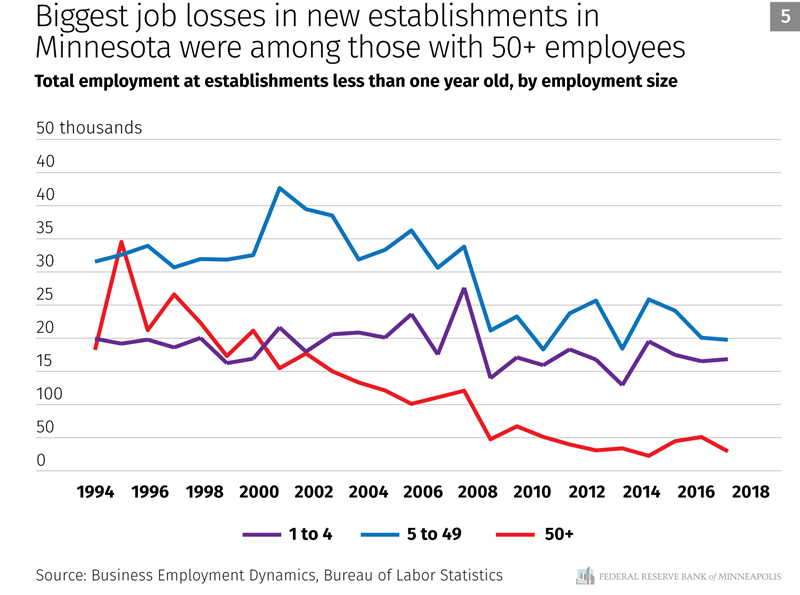
To some extent, that probably shouldn’t be surprising; the ability to cut labor at a company with one to four workers is more limited than at a firm with dozens of employees. Larger establishments have more incentive (and likely more capital) to invest in labor-saving technology.
Hypothetically, a tight labor market also exacerbates the ability of new establishments to find labor; however, this downward employment trend held its course before, during, and after the Great Recession, which suggests that labor availability does not play a large role in the overall trend. The trend in average employment has flattened out some after a virtual free fall during the recession. But it’s hard to rationalize how this multidecade trend will reverse itself anytime soon, especially in light of tight labor markets.
Other new biz metrics
Data on new establishments miss one major category of businesses: namely, those businesses that don’t employ any workers. Variously called sole proprietors, nonemployers, self-employed, or gig workers, data related to each group offer a slightly different snapshot of new business trends. But taken together, they show the same general pattern of positive but modest growth in Ninth District states.
Nonemployer firms, for example, are entities that have no paid employment or payroll and annual receipts of at least $1,000. These firms have seen a steady increase in the Ninth District (and slightly faster than establishment growth). However, the district growth rate is roughly half that of the national average (Chart 6). Most sectors showed higher growth at the national level, but the disparity was particularly notable in transportation, administrative support, education and health care services, and accommodation and food services. That disparity would be larger were it not for the Dakotas, the only district states where nonemployer firms grew at rates relatively similar to the national rate.
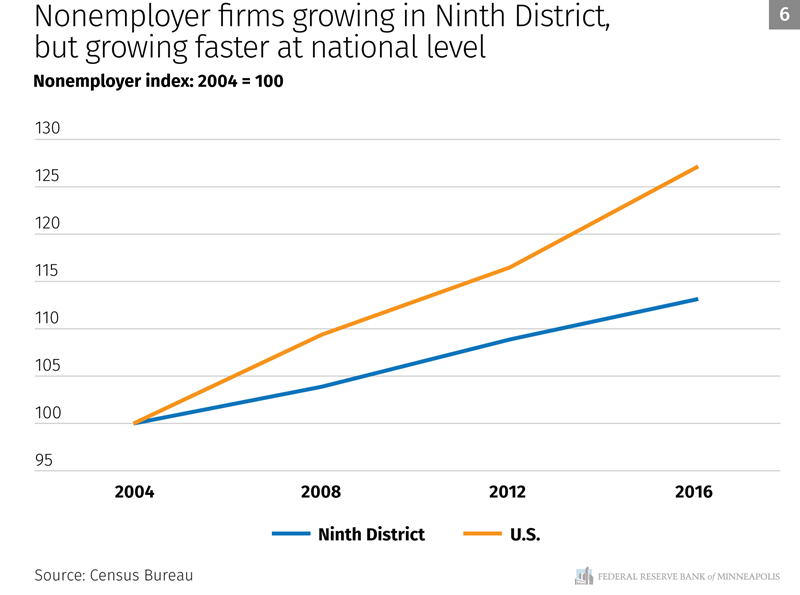
In some cases, geographic market quirks are in play. For example, a disparity in accommodation and food services likely has something to do with trends in both boutique food trucks and short-term housing and vacation rentals, both of which tend to be stronger in urban and coastal areas than in the largely rural Ninth District. Similarly, a growth disparity in the transportation sector appears to stem mostly from the lopsided increase in ride-sharing operators—Uber, Lyft, etc.—whose services have appeared much faster outside the district than inside.
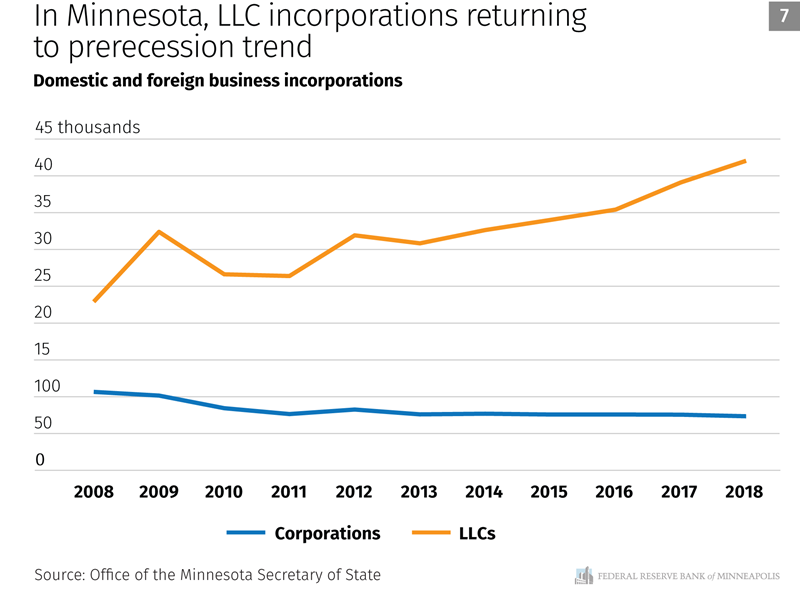
State data also offer some insights into new business activity by virtue of the fact that businesses have to incorporate under one of several ownership structures. The data here need to be interpreted carefully, however; filings for various types of corporations generally have been on the decline since the introduction of the limited liability company. LLC incorporations, in turn, have increased dramatically, but include an unknown (but considerable) number that are businesses on paper only, whose sole purpose is for liability protection rather than as a going business concern. Nonetheless, it’s clear from the dip in LLC incorporations in Minnesota after the recession that new business creation of late—whatever its real number—has resumed a healthy upward tack (Chart 7).
In summary, the data suggest that while new businesses aren’t employing the number of workers they once did, the economy’s ability to create new firms has nonetheless regained its footing from the shock of the Great Recession.
Ron Wirtz is a Minneapolis Fed regional outreach director. Ron tracks current business conditions, with a focus on employment and wages, construction, real estate, consumer spending, and tourism. In this role, he networks with businesses in the Bank’s six-state region and gives frequent speeches on economic conditions. Follow him on Twitter @RonWirtz.