Preserving the affordability of naturally occurring affordable housing is a cost-effective approach to maintaining a full range of housing choices in a community. One preservation option for cities in Minnesota is to invest in local expansion of the state’s Low Income Rental Classification (LIRC). By estimating the benefits and costs of local LIRC expansion, a new tool developed by the Federal Reserve Bank of Minneapolis can help inform cities’ decision-making.
In Minnesota, owners of qualifying affordable rental housing are eligible for reduced property taxes through the LIRC, also known as “4d.” To receive a property tax reduction, owners of developments that receive public financial assistance agree to limit rents and impose restrictions on tenant incomes. While most owners of units with the 4d tax classification receive their financial assistance through federal or state programs, some local governments in the Twin Cities area now provide financial assistance as well to encourage property owners to set aside additional rent-restricted units and benefit from 4d. However, local governments must consider how 4d property tax reductions will affect other property tax payers, whose taxes increase accordingly to make up for lost revenue. To help local policymakers evaluate the benefit of more rent-restricted affordable units against the financial impacts on other property tax payers, our team at the Minneapolis Fed has put together an online tool to estimate the tax implications of 4d program expansion.
How 4d benefits property owners
Properties qualify for the State of Minnesota’s 4d tax classification in a variety of ways, including if “the units are subject to rent and income restrictions under the terms of financial assistance provided to the rental housing property” by a local, state, or federal government, and assisted units are “occupied by residents whose household income at the time of initial occupancy does not exceed 60 percent of the greater of area or state median income, adjusted for family size.”1 To participate in 4d, at least 20 percent of total residential units in the property must meet these rent and income restrictions.
Once enrolled, owners of rental housing units receive a 40 percent reduction in their property tax class rate, which takes it from the normal 1.25 percent down to 0.75 percent, for the first tier of market valuation (up to $162,000 per unit in 2020, updated annually) and a 0.25 percent class rate for the remaining value. For example, in St. Paul, the owner of a 120-unit building with an annual property tax of $123,000 could reduce their annual property tax by $10,000 by enrolling 24 units in the 4d program.
How 4d supports affordable housing
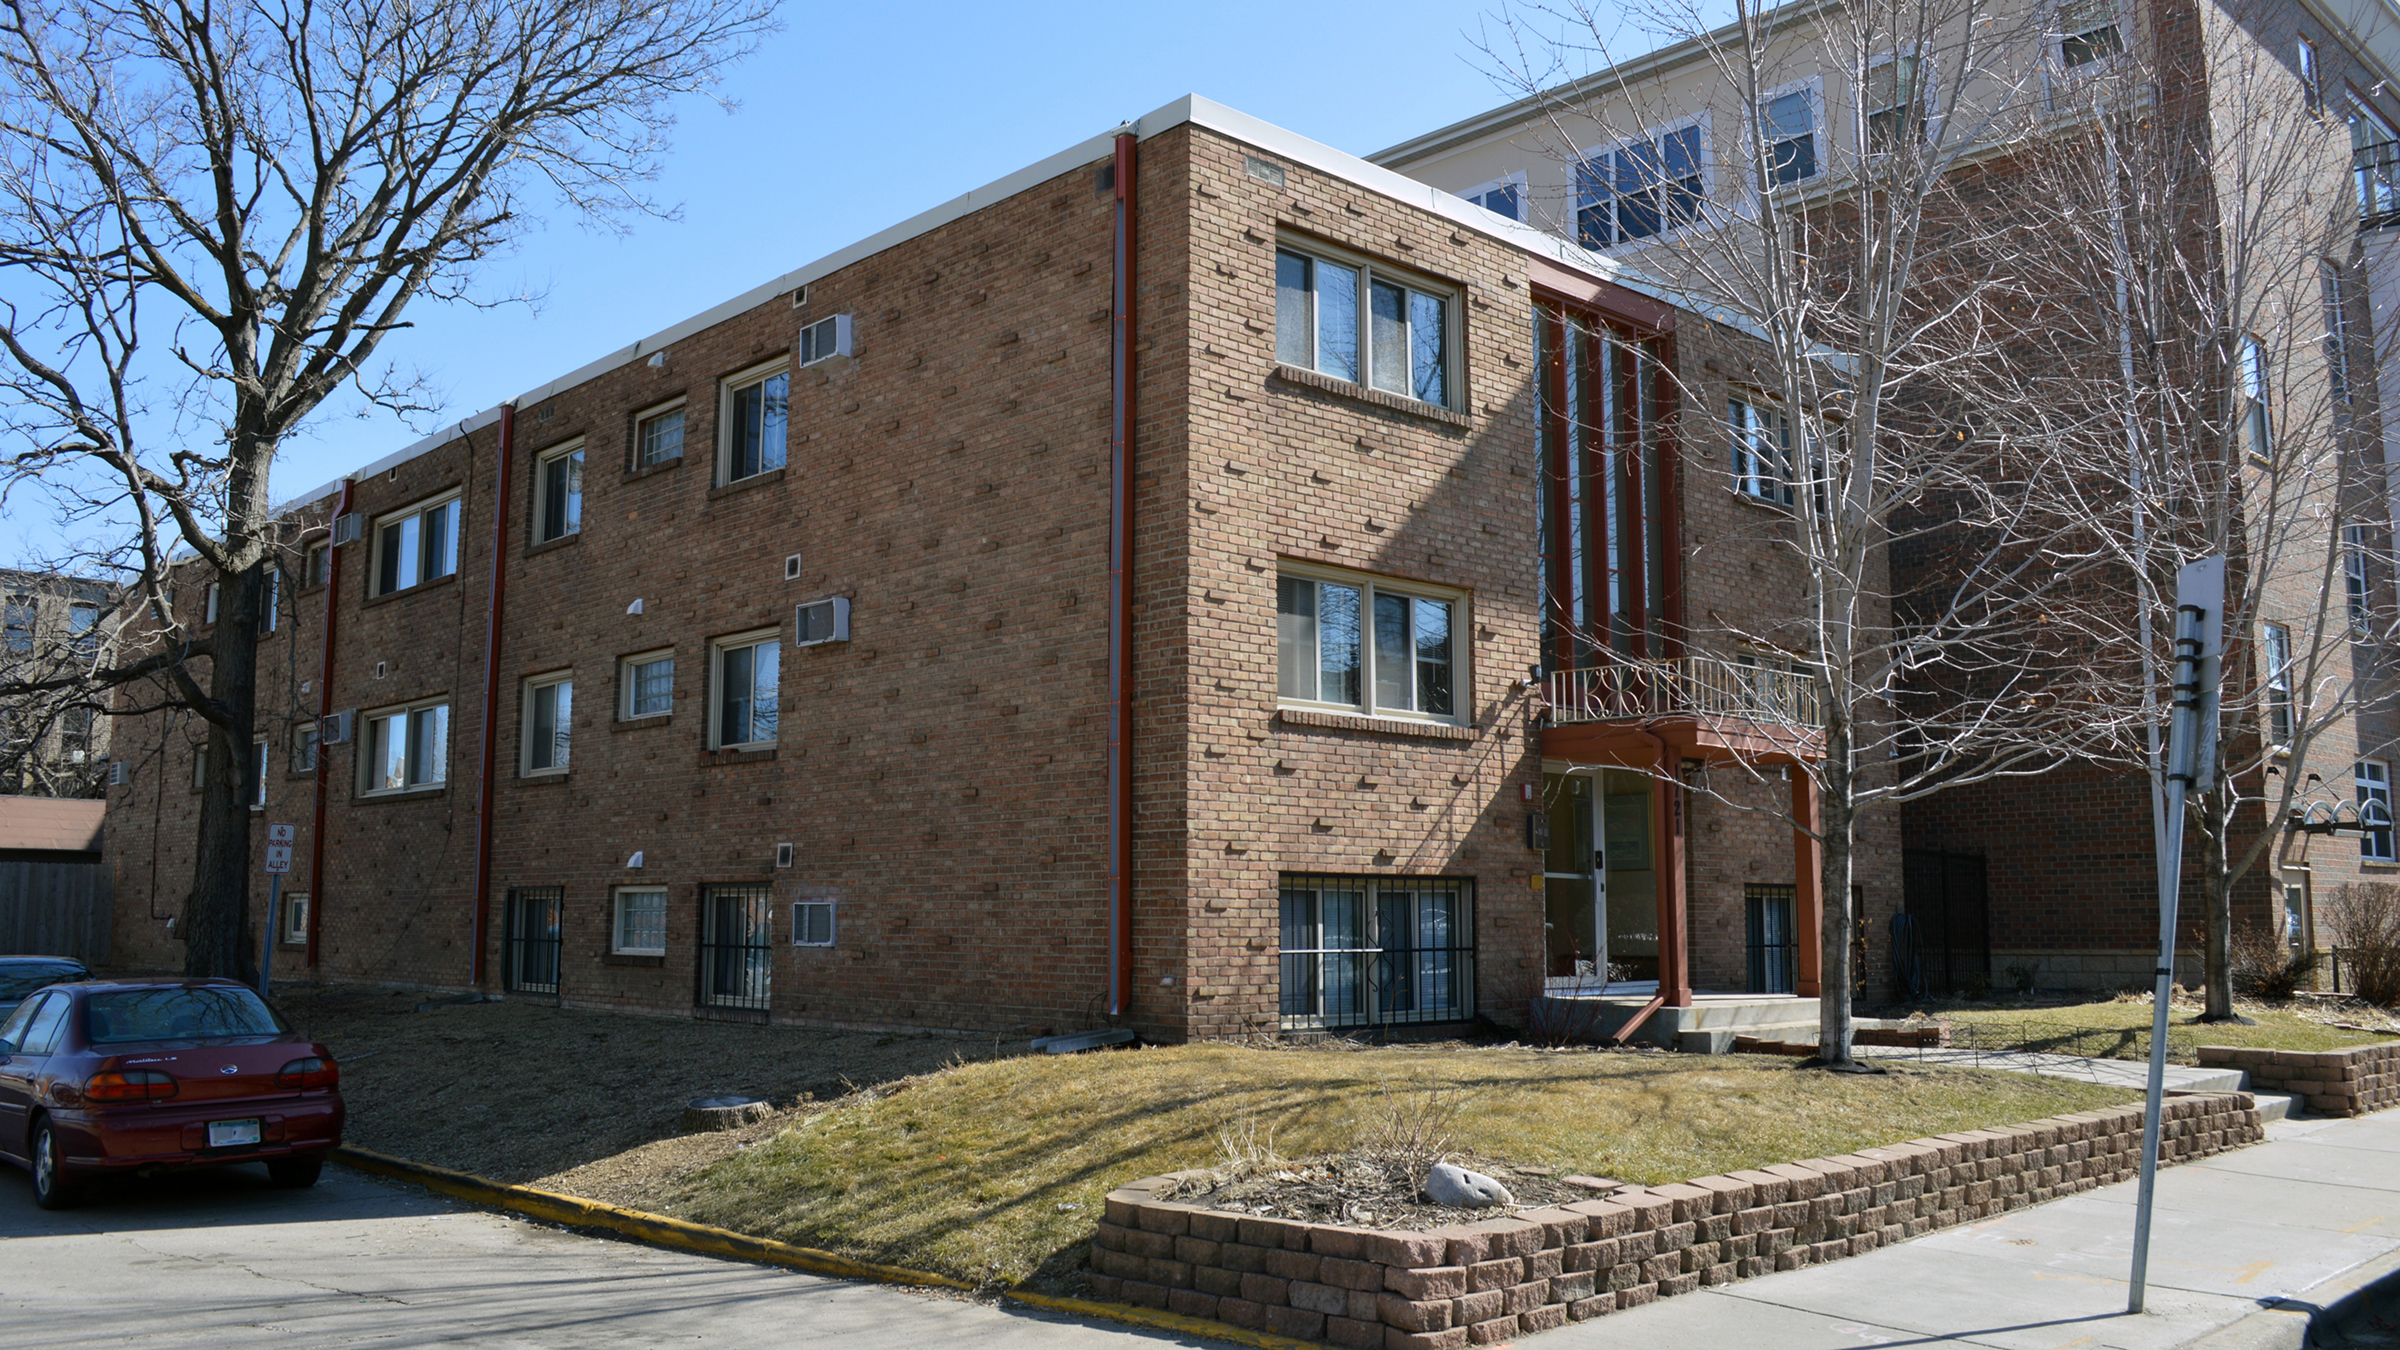
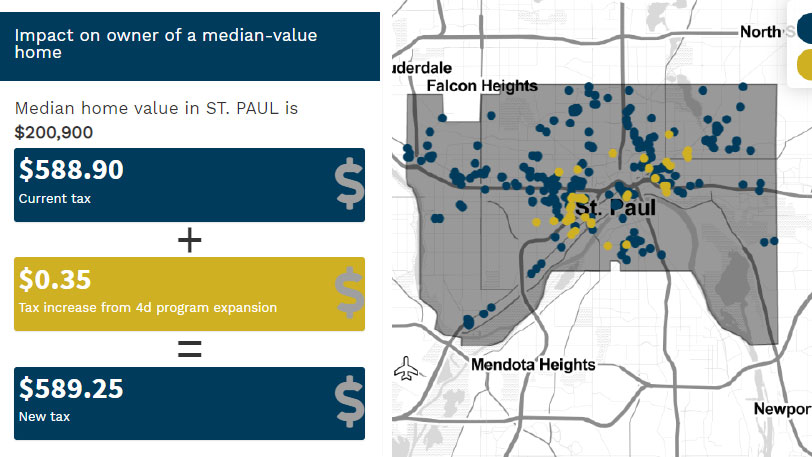
While the 4d program primarily assists units developed with funding from federal and state affordable housing programs, such as the Low Income Housing Tax Credit, local governments can use 4d as a tool to preserve naturally occurring affordable housing, or NOAH. Constructed without public subsidy, NOAH units have often aged into affordability. Since their owners are not committed to applying income or rent restrictions, NOAH units are the type of affordable housing most vulnerable to being lost to rent increases, particularly in desirable neighborhoods. By offering property owners financial assistance to trigger 4d eligibility in exchange for commitments to restrict rents, local governments, such as the cities of Edina, Golden Valley, Minneapolis, St. Louis Park, and St. Paul, are preserving the long-term affordability of NOAH units. For the additional 24 income- and rent-restricted units described in the previous example, the $10,000 in property taxes that the landlord saves shifts to other taxpayers in St. Paul; our methodology estimates that the owner of a median-value home (estimated at $200,900) in the city would pay an additional $0.02 in property taxes to the city.
Local governments that choose to extend financial assistance to preserve NOAH through a local 4d program set their own parameters for eligibility within the statutory requirements. All local programs presently pay for the State of Minnesota’s first-year application fee ($10 per unit) and fees for recording the declaration of rent and income restrictions. Many cities offer participating properties additional incentives, such as free energy assessments and cost-sharing on energy improvements.
| 4d parameter | Edina | Golden Valley | Minneapolis | St. Louis Park | St. Paul |
|---|---|---|---|---|---|
| Eligible buildings | At least four units | At least ten units | At least one rental unit, including single-family homes | At least two rental units | At least one rental unit, including single-family homes |
| Owner-occupants allowed? | Yes | No | Yes | Yes | Yes |
| One-time grants per affordable unit | $100 | $100 | $100 | $200 | $75 per unit at 60% AMI; $200 per unit at 50% AMI |
| Maximum grant per property | $2,500 | $1,000 | $1,000 | $6,000 | $1,200 |
| Length of affordability declaration | Two years | Ten years | Ten years | Five years | Ten years |
| Minimum share of building’s units with affordability | 20% | 30% | 20% | 20% | For buildings with three or more units, at least 20% of units affordable to 50% AMI or below, OR; at least 50% of units affordable to 60% AMI or below |
| Maximum annual rent increases to existing tenants | 6% | 5% | 6% | 5% | 3% |
The benefits of local governments’ 4d programs are available only for units that do not already qualify for the 4d tax status as a result of other federal, state, or local financial assistance programs. When buildings are sold, cities require that the declarations of affordability for 4d status run with the property through the lifetime of the declaration.
How our tool helps local governments
To help you understand what a local 4d program might mean to your city property taxes, we’ve created the 4d Impact Estimator tool. For any city within the seven-county Twin Cities area, the tool enables users to set how many additional properties might qualify for the program, an average percent of units qualified for the program within each building, and minimum number of units in a building. With these inputs, the tool calculates the number of additional housing units whose owners agree to new income and rent restrictions as a condition of 4d participation, the change in the city’s net tax capacity rate (net levy divided by total tax capacity) and the increase in property taxes for an owner of a median-value home in the city.
Our tool also enables users to compare small area fair market rents, as calculated by the U.S. Department of Housing and Urban Development, with rents that would be affordable to families earning 60 percent of area median income. Where existing rents are below these thresholds, expansions of 4d eligibility are unlikely to result in any expansions of housing affordability.
While expanding 4d has tax implications for all taxing jurisdictions (e.g., school districts, counties, and other special taxing districts), the focus of our tool is on city taxes only. By excluding all but city taxes, the tool underestimates the direct financial impact to homeowners but indicates the relative impact on their other property taxes. While the tool only provides a one-time estimate of the scope of impact of local 4d expansions, we hope that it will help local governments make informed decisions about scaling the benefits and costs of the 4d program to their renters and homeowners.
How we calibrated our tool: Methods
How do we identify eligible properties for 4d qualification?
We define a potential property as any property in a given city that is classified as an apartment building and not already enrolled in the 4d program.2 These property records are from the MetroGIS Regional Parcel Dataset. When a user selects the number of additional properties to enroll in the 4d program, the tool picks the oldest properties by year built from the pool of potential properties. If there are multiple properties that meet the criteria, the tool chooses the buildings with the most units. In practice, the properties that owners choose to include in a local 4d program may or may not be these same buildings, but age is a reasonable proxy for buildings that may have aged into affordability.
How reliable are the data?
According to MetroGIS, the Regional Parcel Dataset contains an estimated market value for at least 95 percent of all parcels in any of the seven counties, and the year built for 79 to 93 percent of parcels across the seven counties. Unfortunately, the number of residential units is not as well-populated. In fact, only in Dakota, Ramsey, and Washington counties do most property records contain the number of units. For Anoka, Carver, Hennepin, and Scott counties, only 0 to 1 percent of property records contain that information. For these four counties, we estimate the number of units by looking at the unique values that appear in a MetroGIS data field called “View ID.” This method tends to underestimate the number of units but provides the data necessary for our calculation. However, we recognize that underestimating the number of units may lead to underestimating the number of additional households that would have access to affordable housing from 4d expansion and overestimating the tax implications. (For example, let’s say there’s a ten-unit apartment building in Anoka County valued at $1,000,000, or $100,000 per unit. If the “View ID” method yields an estimate of five units instead of the actual ten, then our tool would estimate the per-unit value at $200,000. This would push the taxable market value per unit past the first tier—i.e., the tier valued at up to $162,000—where the class rate discount is 40 percent, to the second tier where the discount is 80 percent, resulting in an overestimation of tax implications.)
How do Minnesota property taxes work?
To understand how an expansion of the 4d program may affect other property owners, we first need to understand how the property tax system works in Minnesota. Property owners pay property taxes to various jurisdictions including the city, school district, and county. To keep it simple and be consistent with the focus of our tool, we’ll focus on the tax that is owed to the city only.
Ultimately, the tax a property owner is due to pay the city depends on the property’s taxable market value, its property tax class rate, and the city’s certified levy—the amount of property taxes the city expects to receive in a given year. The taxable market value is the property’s market value less any exclusion. For example, a homesteaded residential home—occupied by its owner as their primary residence—is qualified for the homestead exclusion. The city’s net levy—the actual amount of property taxes collected from property owners—may be less than its certified levy as the result of the Fiscal Disparities Program and other state aids.
The tax capacity of a property is its taxable market value multiplied by its class rate. To calculate the city’s total tax capacity, we sum the property-level tax capacities across the city. The tax-capacity rate is then determined by dividing the city’s net levy by the total tax capacity.
The amount a property owner owes to the city is then calculated as the tax-capacity rate multiplied by the property’s tax capacity.
For example, if a homesteaded property has a market value of $300,000 and the tax capacity rate is 50 percent, then:
Homestead exclusion3 = ($76,000 × 40%) - ($224,000 × 9%) = $10,240
Taxable market value = $300,000 - $10,240 = $289,760
Tax capacity = $289,760 × 1% = $2,897.60
Tax owed = $2,897.60 × 50% = $1,448.80
How does expanding the 4d program affect local homeowners?
The tax a property owner owes the city every year depends on the property’s tax capacity and the city’s tax levy. Changes to the classification of a property affect its tax capacity. A property’s enrollment in the 4d program reduces both the property’s tax capacity and the city’s total tax capacity. The city’s tax-capacity rate increases, since the tax-capacity rate is the net tax levy divided by the total tax capacity. Since the tax-capacity rate is used to determine how much tax a property owner owes, an expansion of the 4d program will ultimately affect the tax bill of other local taxpayers, including local homeowners.
To expand on the homesteaded-property example above, let’s say the city’s total tax capacity is $2,000,000 and its tax levy is $1,000,000, which gives us the 50 percent tax-capacity rate. And say this city expands its 4d program to add 10 more buildings, which results in a $100,000 decrease in tax capacity. Then, the new tax capacity is $2,000,000 - $100,000 = $1,900,000 and the new tax-capacity rate is $1,000,000 / $1,900,000 = 52.63%. Now the homeowner whose home is valued at $300,000 would pay $2,897.60 × 52.63% = $1,525.00, which is a $76.20 increase over the amount the homeowner would pay before the 4d expansion.
The authors thank Gary Carlson, Daniel Lightfoot, and Jared Swanson for their willingness to share their expertise on the Minnesota property tax system.
Endnotes
1 Quotes are from 2012 Minnesota Statutes § 273.128.
2 The tool focuses on apartment buildings of four or more units only. Other structure types (e.g., duplexes) can also be enrolled in the 4d program but are not included in our analysis.
3 The homestead exclusion is 40 percent of the home value for up to $76,000 less 9 percent on the remainder between $76,000 and $413,000. For properties that are valued at $413,000 or above, there is no valuation exclusion. A homesteaded property has a class rate of 1 percent in 2020.
Libby Starling is Senior Community Development Advisor in Community Development and Engagement at the Federal Reserve Bank of Minneapolis. She focuses on deepening the Bank’s understanding of housing affordability, concentrating on effective housing policies and practices that make a difference for low- and moderate-income families in the Ninth Federal Reserve District.


