Authors


Nina Leo
Creative Director
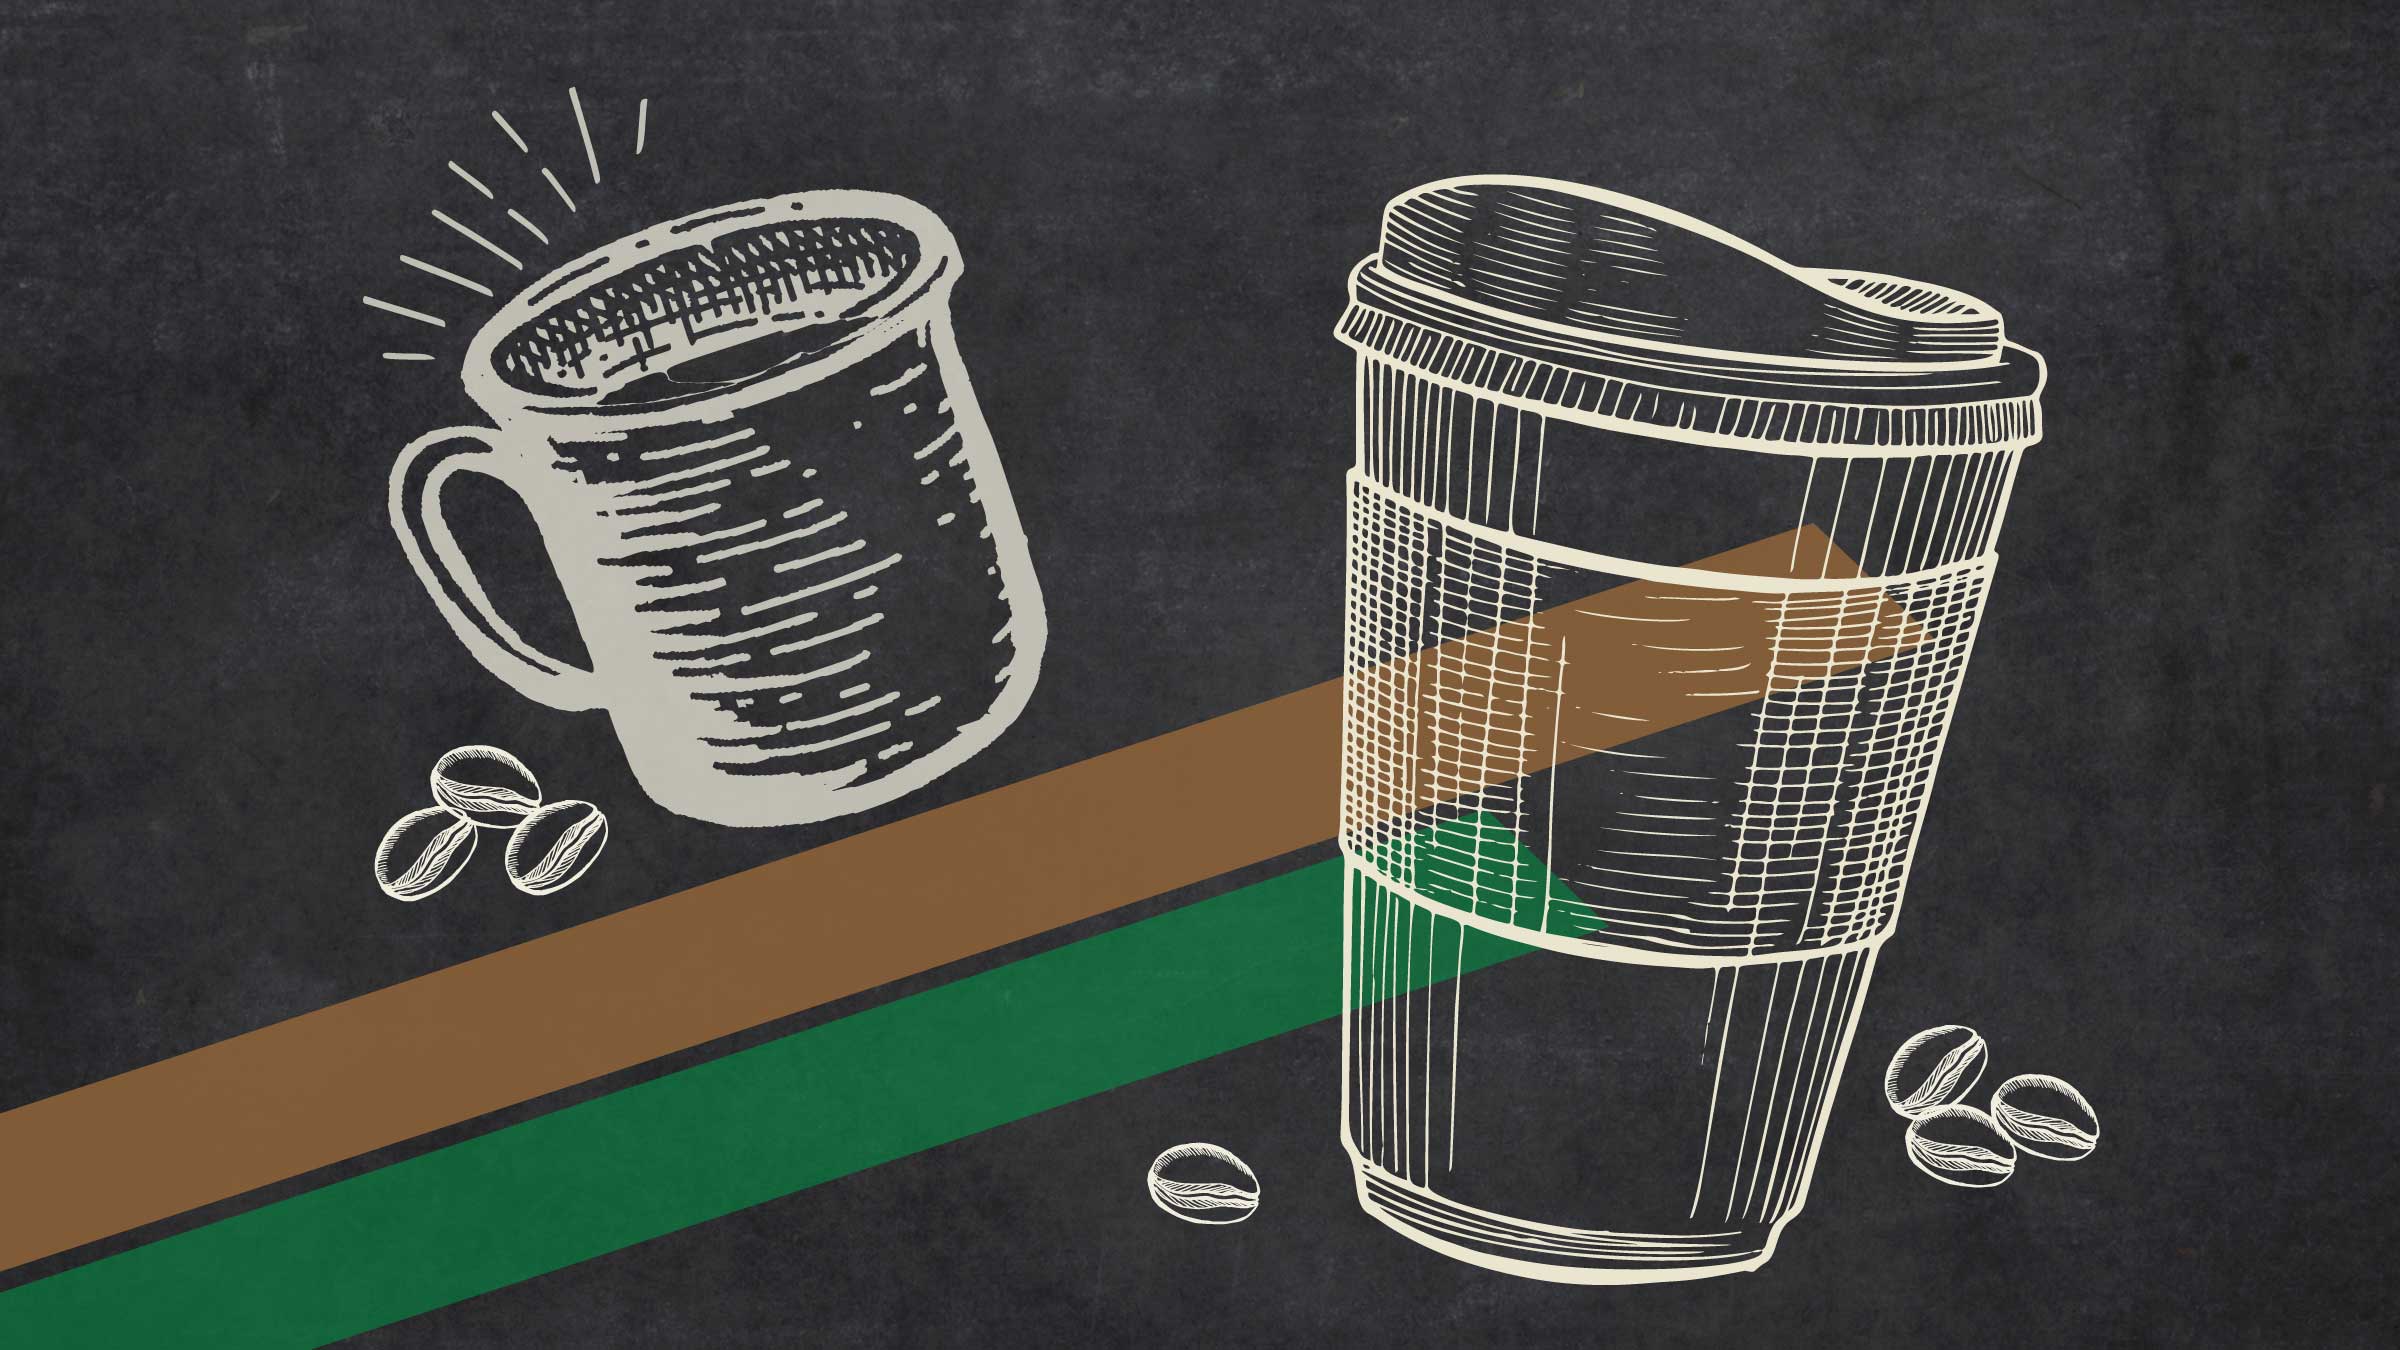
Instant, drip, French press, espresso—many of us can’t get started without that first cup of joe. Would you change your cup, however, if your coffee fix got more expensive?
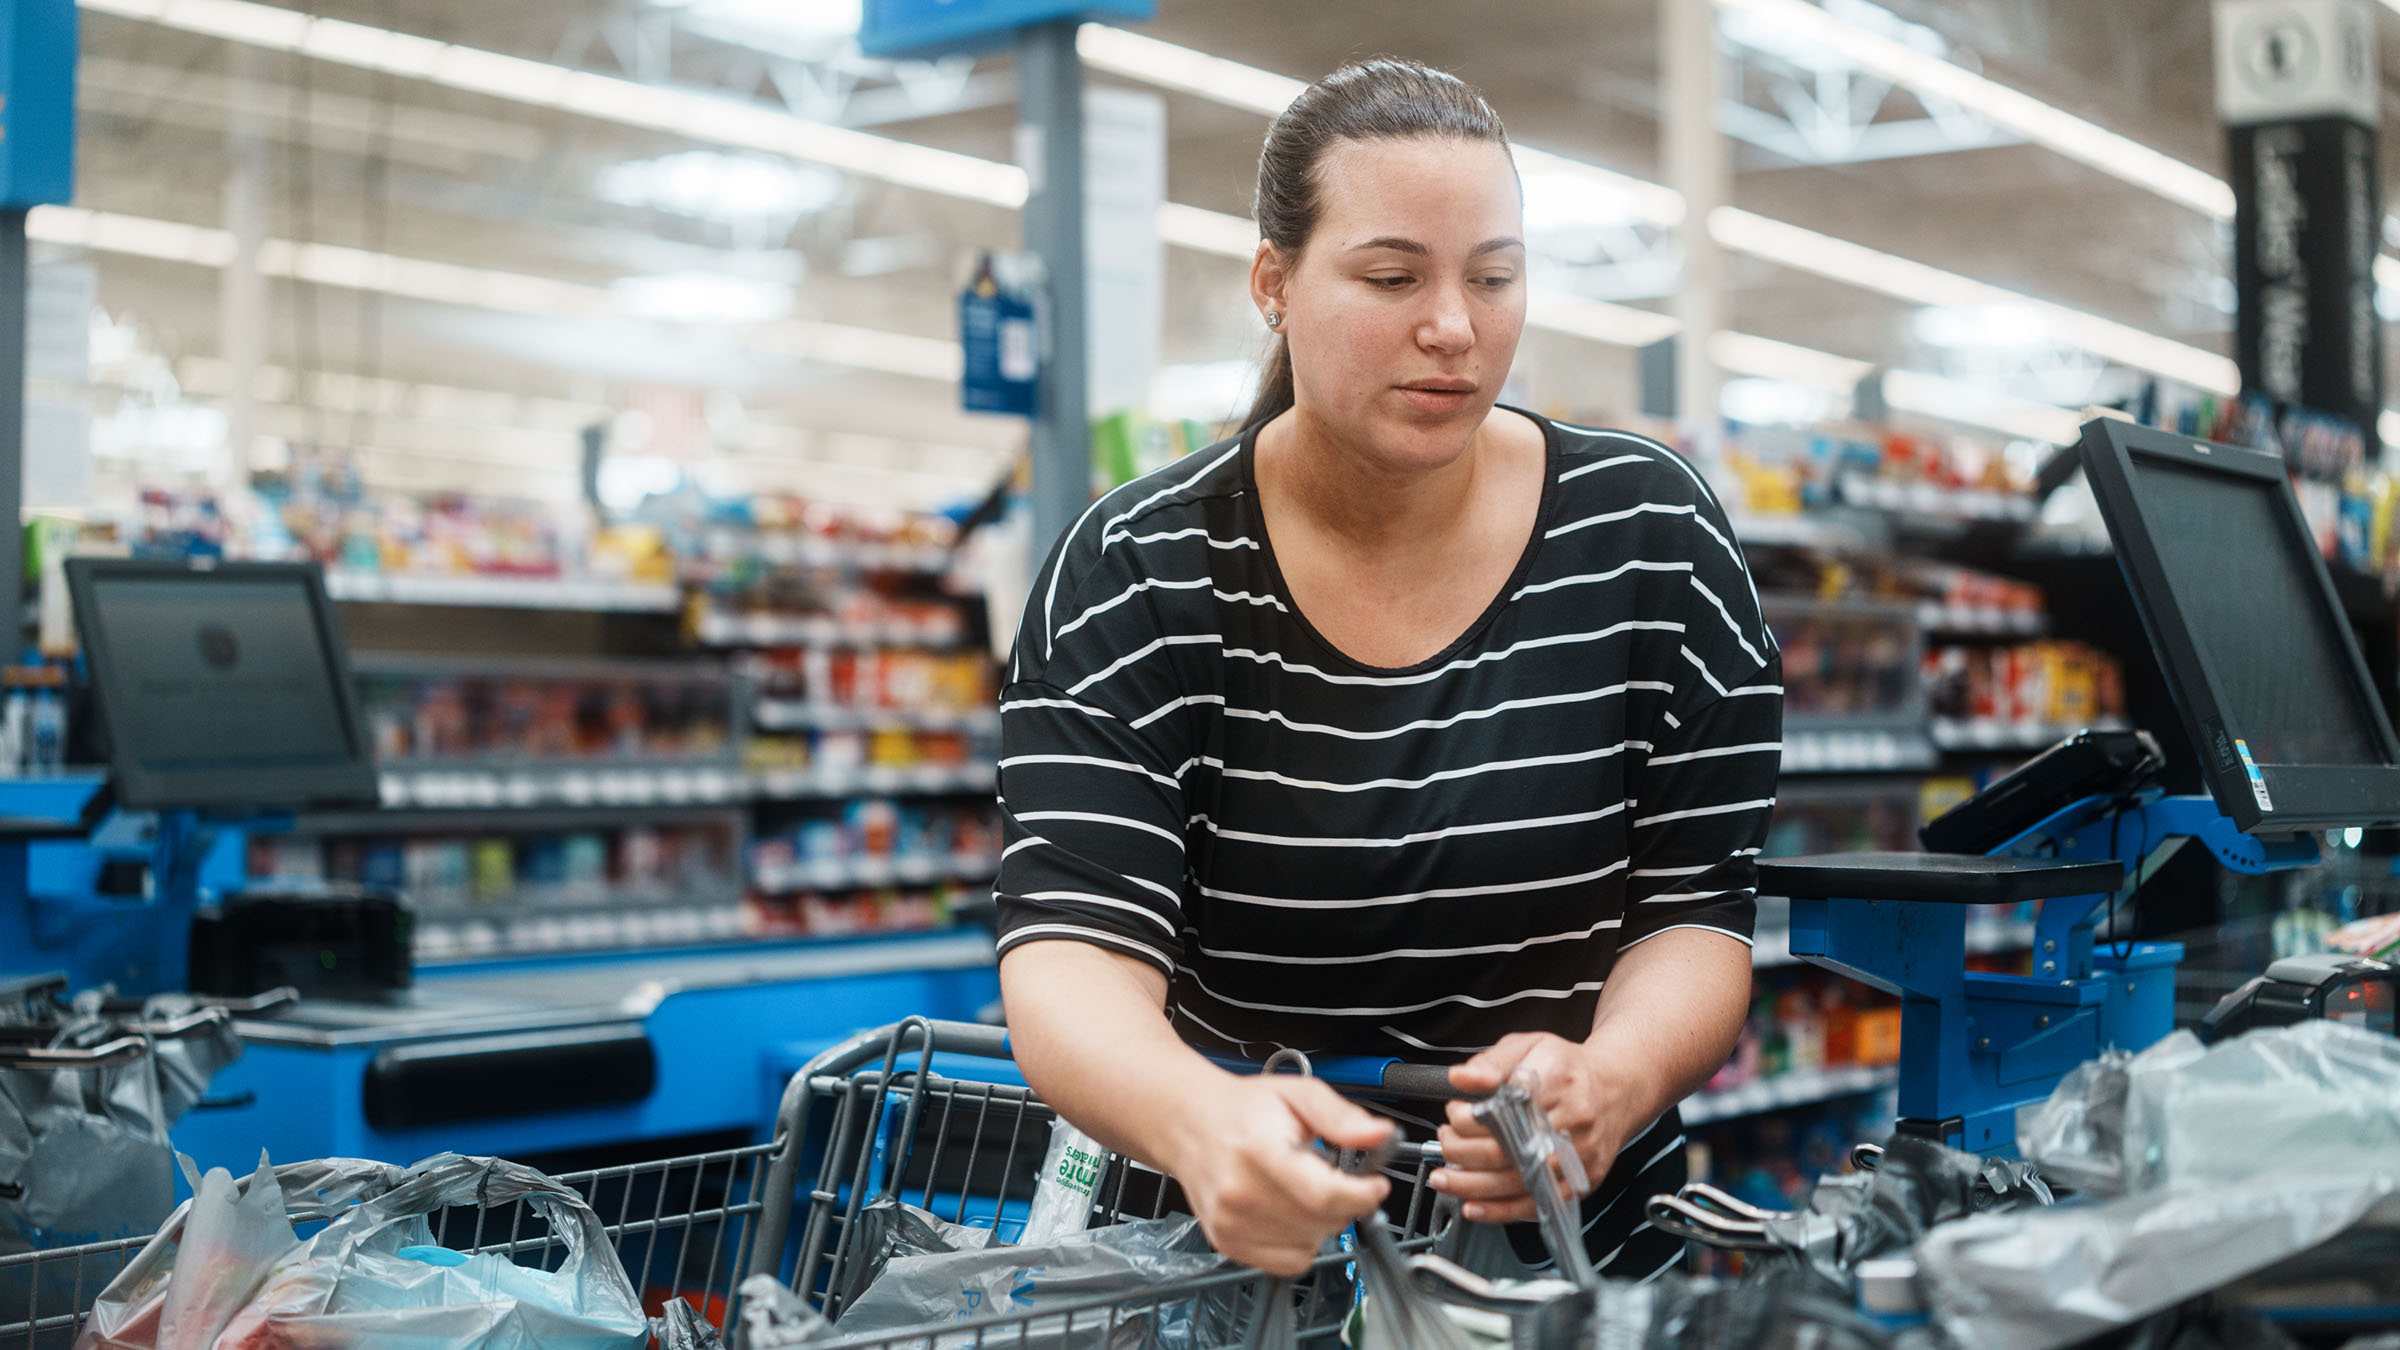
Higher-income households have more options than lower-income households when prices rise: Clip coupons, buy cheaper beans, cut back on those $6 mochas. Low-income households are likely minimizing costs already, leaving them with fewer strategies to avoid the pain of rising prices. Here’s how actual 2022 coffee inflation might play out for two households shopping for 5 pounds of coffee when one can adapt—even a little—and the other cannot without cutting back.
| 2021 | 2022 | Inflation | |
|---|---|---|---|
 Roasted beans Roasted beans |
$12.00/lb | $14.48/lb | 20.7% |
 Instant coffee Instant coffee |
$6.00/lb | $7.00/lb | 16.7% |
| 2021: $10.80/lb |
Inflation: 6.4% |
| 2022: $11.49/lb |
| 2021: $6.00/lb |
Inflation: 16.7% |
| 2022: $7.00/lb |
Lower income, higher cost of living
New research by former visiting scholar David Argente and Munseob Lee presented at the Institute’s spring conference confirms that higher-income households can respond more to price increases than lower-income households. As a result, since 2008, lower-income households have experienced faster cost-of-living increases than higher-income households. Argente and Lee’s data on consumer goods show that about half of this effect is due to differences in shopping behaviors. The rest comes from higher inflation on items that are necessities, which make up a larger share of low-income households’ spending. This price level gap appeared during the Great Recession, when everyone was tightening their belts, and was still present as of 2019.
This figure shows how a price index for consumer goods (approximately 40% of household spending) has changed over time compared to the first quarter of 2004.
Sources: Roasted beans and instant coffee annual inflation rates from the July 2022 release of the Consumer Price Index, Bureau of Labor Statistics. Price levels for high- and low-income households from Argente and Lee, “Cost of Living Inequality During the Great Recession,” Kilts Center for Marketing at Chicago Booth, Nielsen Dataset Paper Series 1-032. Coffee prices from 2021 are authors’ estimates.
This article is featured in the Fall 2022 issue of For All, the magazine of the Opportunity & Inclusive Growth Institute
Lisa Camner McKay is a senior writer with the Opportunity & Inclusive Growth Institute at the Minneapolis Fed. In this role, she creates content for diverse audiences in support of the Institute’s policy and research work.