

- Speech(video)
- Media Q&A(video)
- Media QA(audio)
- Q&A(video)
- Speech and Q&A(audio)
Note1
Thank you for that generous introduction, and thank you for the opportunity to speak to you today. It’s a delight to be back in Helena. As you heard, I’m the president of the Federal Reserve Bank of Minneapolis. The Federal Reserve Bank of Minneapolis has only one Branch office—and it’s in Helena! As a result, Helena has been a regional center for the Minneapolis Bank’s operations since the Branch opened in 1921. Personally, I’ve benefited greatly from this arrangement, since it’s provided me with an excuse to visit the “Queen City of the Rockies” on many occasions over the past few years. I’ll have more to say about the Helena Branch, and especially its board of directors, later in my remarks.
My speech today focuses on the behavior of the labor market over the past eight years. At the end of 2013, many observers were concerned that the Great Recession of 2007-09 had created a new downgraded baseline for U.S. labor markets. But, as I will show you, the United States experienced rapid improvement in labor market performance in 2014. There is no longer evidence that the American labor market is trapped in some kind of dismal “new normal” in the wake of the Great Recession.
In the absence of such evidence, I believe that policymakers should strive to facilitate ongoing improvement in labor market outcomes until they more closely resemble those that prevailed before the Great Recession. I use a series of charts to show that the process of improvement is likely to take some time. By some key metrics, the labor market improved more in 2014 than it had in almost 20 years. Yet, by these same metrics, we would need to see at least three more years like 2014 for labor market conditions to return to their 2006 levels. It follows that monetary policymakers should be extraordinarily patient about reducing the level of monetary accommodation.
I look forward to taking your questions at the end of my prepared remarks. For me, those questions are a highlight of these speaking engagements. As I will discuss, two-way communication between policymakers and citizens is a core function of the Federal Reserve System. Your questions are a key part of that two-way communication.
The views that I express today are my own and are not necessarily those of others in the Federal Reserve System.
Federal Reserve System basics
Let me begin with some basics about the Federal Reserve System. I like to tell people that the Fed is a uniquely American institution. What do I mean by that? Well, relative to its counterparts around the world, the U.S. central bank is highly decentralized. The Federal Reserve Bank of Minneapolis is one of 12 regional Reserve Banks that, along with the Board of Governors in Washington, D.C., make up the Federal Reserve System. Our bank serves as the headquarters for Federal Reserve operations in the ninth of the 12 Federal Reserve districts, which includes Montana, the Dakotas, Minnesota, northwestern Wisconsin and the Upper Peninsula of Michigan.
Eight times per year, the Federal Open Market Committee—the FOMC—meets to set the path of monetary stimulus over the next six to seven weeks. All 12 presidents of the various regional Federal Reserve banks—including me—and the governors of the Federal Reserve Board contribute to these deliberations. However, the voting members of the Committee itself consist only of the governors, the president of the Federal Reserve Bank of New York and a rotating group of four other presidents. In this way, the structure of the FOMC mirrors the structure of our government, because representatives from different regions of the country—the various presidents—have input into FOMC deliberations.
This decentralized system has many desirable attributes. I believe that one of the most important is that it facilitates two-way communication between the nation’s central bank and the nation’s citizens. We’re engaging in one direction of this communication right now, as I tell you about key considerations regarding monetary policy. In the other direction, the Federal Reserve Bank of Minneapolis gathers valuable economic information from local contacts in a variety of ways. I then take that information forward to the FOMC as part of my contributions to that deliberative process.
Our Bank’s board of directors, and the board of directors of the Branch office here in Helena, are especially important sources of information to my staff and me. I’d like to spend the next few minutes explaining the role that they play. Let me start with the Minneapolis Fed’s board of directors. It has nine members and meets eight times per year, a couple of weeks before each FOMC meeting. In a lot of ways, these meetings are like those of any other board, as our board fulfills its oversight responsibilities for the operations of the Bank. But the central part of each of our board’s meetings consists of the members’ sharing and discussing economic intelligence gathered from their customers and other business contacts. My staff and I follow these conversations closely, and they are a basis for what I communicate later to the FOMC.
Of course, this conversation would not be all that valuable if our board members were all denizens of downtown Minneapolis who were engaged in the financial industry. What makes the process of gathering and sharing information effective is the diversity of perspectives on our board. We get valuable information from leaders of large multinational corporations like Pentair and General Mills, philanthropic organizations such as the Wilder Foundation, as well as community banks and small businesses from across the district. In this way, the board features economic diversity. It also features gender diversity—there are four women on the board. Perhaps not surprisingly, it also features geographical diversity—it includes residents of the Dakotas, Wisconsin, Minnesota and—last but not least!—Larry Simkins, CEO and president of the Washington Companies, from Montana. This diversity of perspectives means that my staff and I are hearing about the complex Ninth District economy from a wide range of viewpoints—and that can only be a good thing. We continue to seek to strengthen our economic intelligence-gathering by enhancing the relatively limited racial/ethnic diversity of the board.
The information-gathering done by our Minneapolis board of directors is constrained by the fact that it has only nine people. Fortunately, our Bank has a number of other ways to gather economic information from the district, including through four advisory councils. Our most important way to gather information about the economy of Montana is through the board of directors of the Helena Branch, whom Sue Woodrow introduced to you earlier. Like the Minneapolis Fed board, the Helena board’s information-gathering is effective because of the board’s basic diversity. There are three women on the Branch board. It has representatives from a number of sectors in the economy, including education, nonprofits and community banking. Geographically, the Helena Branch board includes representatives from all over the state, including Wolf Point, up in the northeast corner of the state, and Missoula in the southwest.
The newest director on our Helena Branch board is, a little unusually, from Helena! Sarah Walsh is the chief operating officer with PayneWest Financial. During the course of her tenure on the board, Sarah may be contacting some or many of you, seeking perspectives on the economic conditions of your particular industry sectors and your communities. Your input regarding what you are seeing and experiencing is important information that Sarah will be reporting on at Branch board meetings. I thank you ahead of time for your public service in assisting Sarah with this part of her role as a Branch board director. More generally, I want to give a shout-out to all of our Minneapolis board directors, our Helena Branch board directors and all of their contacts. Your hard work is a key part of the decentralized process of monetary policymaking here in the United States, and I thank you, on behalf of the Minneapolis Fed, for your dedicated public service.
As I mentioned earlier, this gathering of local economic intelligence is an essential input into my contributions at the FOMC meetings in Washington. At those meetings, we decide on an appropriate stance of monetary policy for the economy. What is the FOMC seeking to achieve by varying monetary policy? Congress has charged the FOMC with making monetary policy to promote maximum employment and to promote price stability. The FOMC has interpreted the second goal, price stability, to mean keeping inflation close to 2 percent.
Employment over the past eight years
I now turn to the FOMC’s performance with respect to its employment mandate over the past eight years—from December 2006 through December 2014. Many metrics are used to measure labor market performance. I will concentrate on what I see as the most basic of these metrics: the fraction of people who have a job.
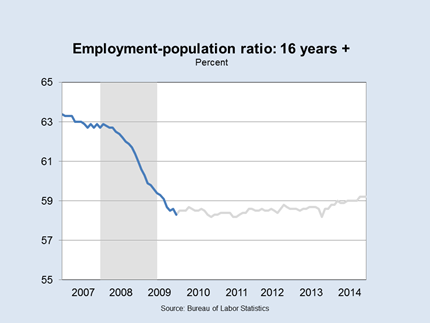
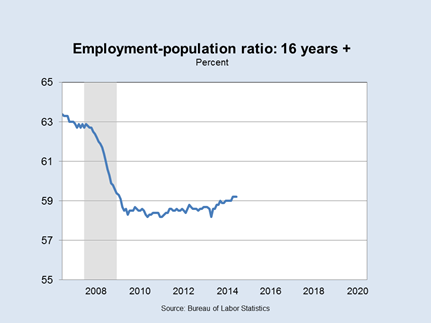
I begin with the three-year period from December 2006 through December 2009. This was a period of relatively rapid deterioration in labor market performance. The fraction of the population over the age of 16 who had a job fell from over 63 percent to just over 58 percent. These people did not suddenly become disabled. Nor did they suddenly decide that they could have more fun playing video games than working. Rather, there was a large group of people with talents and skills who would have been employed in 2006, but were not being utilized by the U.S. economy three years later. In this sense, the 5-percentage-point decline in the employment-to-population ratio represents a dramatic and disturbing waste of America’s valuable human resources.
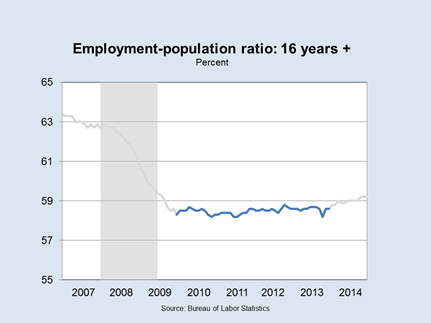
I next show you the four-year period from the end of 2009 through December 2013. At the beginning of this period, 58.3 percent of the population over the age of 16 had a job. At the end of this four-year period, 58.6 percent of the population over the age of 16 had a job. The employment-population ratio remained essentially unchanged for four years.
There is a reason to be cautious about viewing this constancy as a sign of stagnation. More and more of the baby boom birth cohort—born between 1946 and 1964—are reaching an age at which we would generally expect them to retire from working. Many think that it would be natural for this demographic force to exert downward pressure on the FOMC’s maximum employment goal.
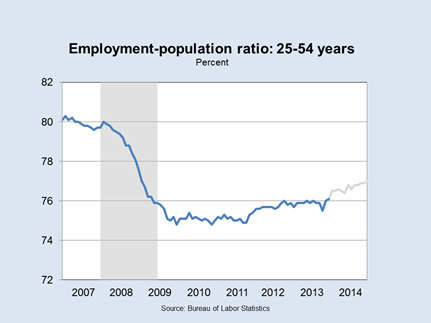
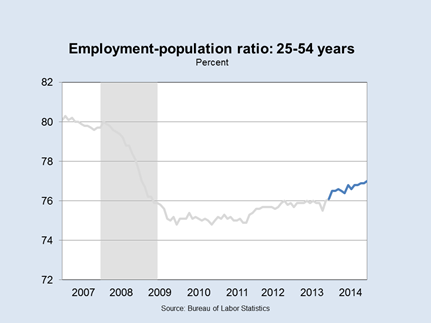
One way to strip out this demographic effect is to look at the behavior of the fraction of those aged 25 to 54 who have a job. Here, we’ve plotted that statistic from December 2006 to December 2013. Its behavior is qualitatively similar to what we see for those aged 16 and over. The fraction of those aged 25 to 54 who had a job fell rapidly from the end of 2006 to the end of 2009. This fraction did grow slightly from 2009 to 2013—but the pace of recovery was sluggish at best.
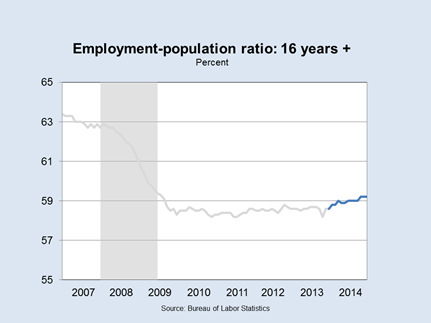
These kinds of data on employment led more than a few observers to be concerned at the end of 2013 that the U.S. labor market was stuck in some kind of adverse “new normal.” Fortunately, we see in the next chart that 2014 showed that this kind of pessimism was unwarranted. In 2014, the fraction of people over the age of 16 who have a job grew by 0.6 percentage points. Although this increase looks modest in the chart, it is equivalent to about 1.4 million jobs (beyond what is required to match population growth) and is tied for the largest December-to-December increase in 17 years.
In a similar vein, the fraction of people between the ages of 25 and 54 who had a job rose by 0.9 percentage points—the largest December-to-December increase in over a quarter century.
I have emphasized the changes in the labor market during the course of last year, 2014. We have now received four months of labor market data from 2015. Economic activity was subdued in the first quarter of 2015; indeed, my own estimate is that economic output, measured in terms of real gross domestic product, may well have contracted during that period of time. Despite this sluggishness, though, key labor market metrics continued to improve, although at a slightly slower rate than what we observed in 2014. The message from 2015 labor market data is the same as from 2014: There is no reason to think of the Great Recession as leading to some kind of “new normal” with weak labor market outcomes.
Promoting maximum employment and extraordinary patience
As I mentioned earlier, the FOMC has been charged by Congress with making monetary policy so as to promote maximum employment. In my view, the performance of the labor market in 2014 has large consequences for how the FOMC should interpret this congressional mandate.
At the end of 2013, the fraction of the population over the age of 16 with a job had remained essentially unchanged for four years. It was plausible—although depressing—to think that labor market performance had been permanently degraded by the Great Recession of 2007-09. Under this pessimistic “new normal” perspective, the FOMC could have been seen as being close to fulfilling its maximum employment mandate.
But 2014 blew up that possibility. As I noted earlier, last year featured the largest improvement in labor market performance in many years. This dramatic change is not consistent with an economy stuck in a post-recession “new normal.” The pessimists were wrong—and so the FOMC should be aiming to facilitate a continuation of the 2014 improvement in the labor market.
How close then is the FOMC to its maximum employment goal? At any point in time, there are large uncertainties about the long-run level of employment in the economy. But the remarkable improvement that we saw in 2014 is strong evidence against the hypothesis that the Great Recession or slow recovery has permanently damaged the U.S. labor force. Without clear signs of such damage, I believe that it is natural for the FOMC to treat the pre-recession year of 2006 as a key guidepost in formulating its employment objectives.2
This raises a natural question: If we think of 2006 as representing maximum employment, how long will it take for the U.S. economy to get back to maximum employment? I now want to show you, via some simple calculations, that we will need at least three more years as good as 2014.
Here’s what I mean. This is a graph of the employment-population ratio from December 2006 through December 2014. We can see that the fraction of people over the age of 16 who have a job in December 2014 remains well below what it was eight years earlier.
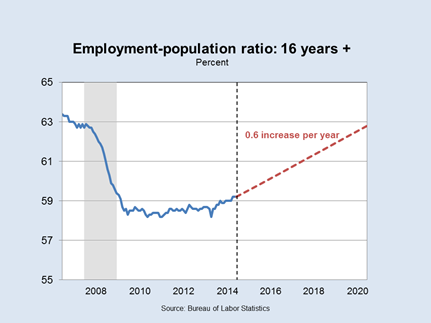
Now, we extend the graph by assuming that the next six years were as good as 2014. The employment-population ratio in December 2020 would still be below that in December 2006.
As I noted earlier, we should be cautious about using this measure of labor market health in light of the aging of the baby boom birth cohort.3 In this next chart, I’ve done a similar extrapolation using the employment-to-population ratio for those aged 25 to 54.
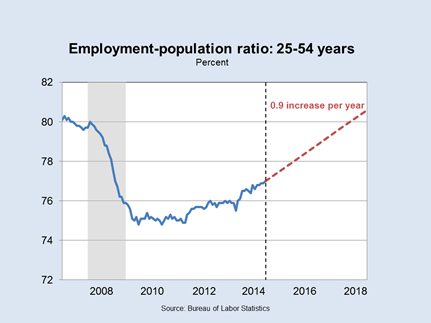
Here, we assume that we had four more years in a row like 2014—that is, 2015, 2016, 2017 and 2018 were all as good as 2014. Then, the fraction of those aged 25 to 54 with a job will be slightly above its level in early 2007.
My discussion has emphasized the employment mandate of the FOMC. However, you will recall that the FOMC is also charged with a second goal: promoting price stability. Accommodative monetary policy pushes upward on prices. In principle, keeping policy sufficiently accommodative to achieve maximum employment could lead inflation to be too high. Along those lines, some observers have suggested that it’s necessary to raise the target for the fed funds rate soon in order to keep inflation under control.
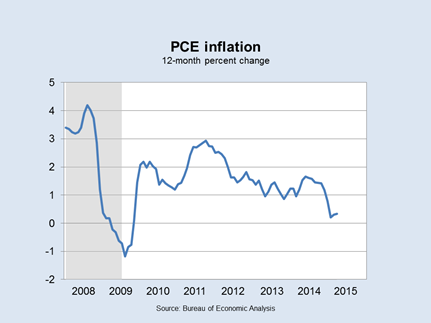
This suggestion is theoretically plausible, but has little support in the data. The FOMC has translated price stability to mean a personal consumption expenditures (PCE) inflation rate of 2 percent. Here’s what inflation has looked like since the start of the Great Recession, more than seven years ago. Over that period, it has averaged 1.3 percent. As of this March, it was 0.3 percent. It has been below 2 percent for nearly three years.
Of course, these data tell us where inflation has been in the past. Monetary policy affects future prices and employment, with a lag that is generally thought to be about 18 to 24 months. Both private sector and public sector forecasters are currently forecasting PCE inflation to remain below the FOMC’s target over that horizon and beyond. In terms of the private sector, the median projection in the May Survey of Professional Forecasters is that PCE inflation will be below 2 percent in 2015, 2016 and 2017. In terms of the public sector, the minutes from the April FOMC meeting specifically state that the board staff’s outlook is that PCE inflation will remain below 2 percent through 2017. These forecasts correspond to my own—as I have been saying for some time, I don’t expect PCE inflation to return to target until 2018.
What do we conclude from this discussion of inflation and employment? I’ve suggested that, given the absence of clear evidence of post-recession damage, the strong labor market conditions of 2006 are a natural benchmark characterization for the FOMC’s goal of maximum employment. Under this perspective, the Committee needs to make policy choices that will lead to more great years like 2014—not one more year like 2014, not two more years like 2014, but at least three more years like 2014. At the same time, my current outlook for inflation is that it will not return to target for three years. Consequently, my assessment is that the Committee will be able to achieve desirable employment or price outcomes only if it is extraordinarily patient about reducing the level of existing monetary accommodation. In particular, I don’t see raising the target range for the fed funds rate above its current low level in 2015 as being consistent with the pursuit of the kind of labor market outcomes that we are charged with delivering.
Conclusions
I am an economist, and economics is often, with good reason, called the “dismal” science. But my message to you today is one of hope and optimism.
From 2006 to 2009, we saw a marked deterioration in labor market performance. As recently as a year ago, it seemed like this loss of human resources might prove to be permanent. But the rapid growth in employment that we saw in 2014 shattered this hypothesis. The lesson of 2014 is clear: We can do better. The FOMC is charged with promoting maximum employment. In the wake of 2014, I see no reason why the Committee should not aim to facilitate continued improvement in labor market conditions. Indeed, I see no reason why we should not aim for the kind of strong labor market conditions that prevailed at the end of 2006.
But we will only get there if we make the right choices. The FOMC can only achieve its congressionally mandated price and employment goals by being extraordinarily patient in reducing the level of monetary accommodation. Under my current outlook, I continue to believe that it would be a mistake to raise the target range for the fed funds rate in 2015.
I have spent some time discussing the important role of Federal Reserve Bank board and Branch board directors in the monetary policy process. I want to conclude by, once again, thanking all of them for their dedicated public service.
Thank you for listening. I look forward to taking your questions.
Endnotes
1 Thanks to Cristina Arellano, David Fettig, Terry Fitzgerald, Rob Grunewald, Claire Hou, Luanne Pedersen, Jenni Schoppers, Sam Schulhofer-Wohl and Niel Willardson for their assistance with these remarks.
2The fraction of those aged 25 to 54 with a job declined slightly from 1999 to 2006. Some have argued that this seven-year statistical pattern is evidence of an ongoing long-term trend decline in employment that monetary stimulus cannot offset without generating undue inflation. However, I am unaware of any economic research that explains the sources of this decline in the 2000s and then documents that these underlying factors have continued to evolve in the same way since 2006. See also footnote 3.
3 Of course, the demographic trends associated with the baby boom birth cohort have been well-understood for years. In November 2007, the Bureau of Labor Statistics released its forecast for the evolution of employment from 2006 to 2016. (See Franklin 2007.) This outlook took full and careful account of a wide variety of demographic trends. It projected that, by 2016, 62.2 percent of those aged 16 and over would have a job. The employment-to-population ratio at the end of 2014 was still about 3 percentage points short of this forecast for 2016.
Reference
Franklin, James C. 2007. “An Overview of BLS Projections to 2016.” Monthly Labor Review. Bureau of Labor Statistics.