Author


Snapshot and methodology
Trying to rationalize or justify the study of Wal-Mart's effect on local communities doesn't take a lot of breath. But determining how to study the firm is a different matter entirely.
So, first, a little background on Wal-Mart in the Ninth District, and then some explanation on the design of the fedgazette's research.
Founded in Bentonville, Ark., in 1962 (the same year, coincidentally, as the Minneapolis-based Target Corp.), Wal-Mart is a latecomer to the Ninth District. The company uses a "radiant" growth strategy that locates stores in relative proximity to existing stores in order to take advantage of the company's superior supply logistics and inventory control systems. This gradually creates both economies of scale and density and is one of the widely cited reasons for Wal-Mart's success.
(For more discussion on Wal-Mart's location strategy, see research by Thomas Holmes of the Federal Reserve Bank of Minneapolis in the March 2006 fedgazette. Look online for Holmes' video that shows Wal-Mart's annual store expansion nationwide.)
The first Wal-Mart came to the Ninth District in 1986, in Owatonna, Minn. (Wal-Mart first came to Wisconsin in 1985, but outside the northwestern portion of the state that is located in the Ninth District.) A relatively small number of stores were added in the late 1980s, but a growth spurt started in 1990, when 16 stores were added just in the district, and 18 more opened the following year. Wal-Mart also entered the Dakotas in 1990, and it did so with a bang—five new stores in North Dakota and six in South Dakota. It wasn't until 1992 that Montana got its first Wal-Mart, followed by two additional stores in both 1993 and 1994.
Today there are roughly 110 Wal-Mart locations (discount and supercenter) in the 303 counties that make up the Ninth District. A majority of stores are supercenters, according to Wal-Mart's 2007 annual report. These stores typically run about 200,000 square feet and carry a full range of both discount and grocery goods. (The district is also home to about 20 Sam's Clubs, the company's wholesale goods outlet, but these were not included in the analysis. Finally, the company operates a chain of Neighborhood Markets, but none is located in the district.)
Counties were chosen as the geographic measure to gauge Wal-Mart effects for two reasons: First, various socioeconomic effects from Wal-Mart likely spill over a much larger territory than the home municipality. Though county borders are imperfect at best, they offer a broader and more realistic territory to gauge change. Second, and equally important for this project, counties are the smallest geographic level available with rich, historical data on familiar measures like firms, jobs and wages.
In designing this study, the fedgazette chose to narrow the number of sites included for investigation. For starters, a 20-year time frame (1985 to 2005) was chosen for analysis to offer a longer-term view of the economic effects of Wal-Mart. The beginning date precedes the first Wal-Mart in the district by one year, with the large majority opening during the 1990s. The end date offers the most recent data on income, employment and other economic variables. Any Wal-Mart locations opened after this date were not included for study consideration. This time frame narrows the universe of Wal-Mart locations to 101, spread relatively evenly across the district.
However, the fedgazette eliminated all larger counties from this analysis for the simple reason that Wal-Mart's effects would be hard to distinguish in larger counties and would present too many confounding factors to reach any firm conclusions. As a result, this analysis focuses exclusively on nonmetro counties (which is how Sam's Club locations came to be eliminated from the analysis).
The advantage of this nonmetro strategy also stems from the fact that Wal-Mart has a much stronger presence in small rural counties than most other discount chain stores. Among 122 district counties with populations between 10,000 and 40,000 in 1985, roughly one-third got a Wal-Mart by 2005.
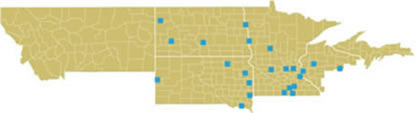
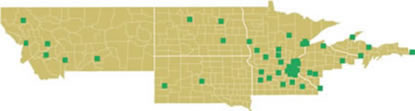
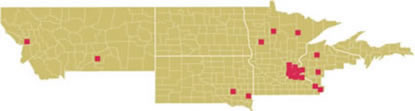
Compare that to Target. Though the company has a stable of stores in Minnesota, including about 20 in areas outside the Minneapolis-St. Paul metro, the company has a much lower profile in other district states and particularly in nonmetro counties that were the focus of this research. Among nonmetro counties in Montana, the Dakotas, portions of northwestern Wisconsin and the Upper Peninsula of Michigan that lie in the district, Target has just six stores; in contrast, Wal-Mart has 24, offering a broader, more inclusive look across the district (see chart below and maps).
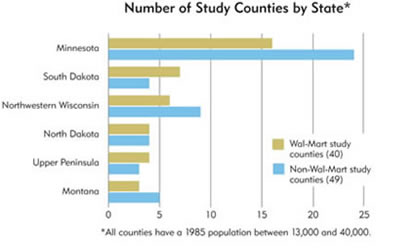
Combined, these factors narrowed the Wal-Mart analysis to a still-sizable 40 counties, all with populations between 13,000 and 40,000 (in 1985). Among the 40 Wal-Mart counties studied, 11 had populations under 20,000 when Wal-Mart opened in the county; 17 had populations between 20,000 and 30,000, and 12 had populations between 30,000 and 40,000. Among the 40 counties studied, 55 percent (or 22) have supercenters, many of them upgraded from previous discount stores since 2000.
A (nonscientific) control group of 49 non-Wal-Mart counties with 1985 population levels between 13,000 and 40,000 was also constructed for comparison purposes. However, counties in this control group are smaller on average and are described in more detail in the cover article. (See map for a visual representation of Wal-Mart and non-Wal-Mart counties investigated.)
With this stable of counties to study, the fedgazette identified certain economic variables that are often the focus of attention when Wal-Mart comes to town—jobs, wages and firms, among others. We then measured changes in these variables over 20 years for Wal-Mart and non-Wal-Mart counties using data from the Bureau of Economic Analysis and the U.S. Census Bureau (including County Business Patterns). The results of this analysis are described in the cover article and the county-level data. [xls]
(Wal-Mart has been challenged on a number of other fronts, including unfriendly labor practices, like the firm's opposition to organized labor, charges of discrimination and reported hiring of illegal immigrants. Critics also point to Wal-Mart's receipt of public subsidies, like the use of Medicaid by employees. While a considerable amount of attention and some research exists on these and still other topics, none of these issues is addressed here in an attempt to focus the discussion more precisely on those elements of community impact that are both more familiar to the reader and easier to measure.)
Price check on salt
Numerous caveats and limitations to the fedgazette results stem from the study's methodology described above. Most important, none of the findings can be considered causal in nature. In other words, the findings don't tell us whether Wal-Mart's presence (or lack thereof) is<> for either positive or negative outcomes over the period studied. Proving a causal relationship between Wal-Mart and local economic trends is beyond the scope of this analysis.
The 20-year period of analysis also does not weight "total Wal-Mart years" or otherwise account for the variable time frame that individual Wal-Marts have been in business in various counties, though some effort was taken to investigate this time-sensitivity matter (see cover article).
The fedgazette methodology also cannot account for any selection bias inherent in the places Wal-Mart has chosen to locate. It's hard to determine how much of a factor this is; as mentioned earlier, Wal-Mart differs from many retailers in its location decision making. It often puts more weight on proximity to existing stores and distribution hubs than on more common location factors like market size. (See the Holmes research for more discussion.)
Still, Wal-Mart is world-famous for doing its homework and is likely to pick counties that have good prospects for growth, all other things equal. If counties chosen by Wal-Mart for new stores are positioned for growth, then Wal-Mart could be riding those economic coattails, and the firm's local effects could be muted or distorted as a result. Some effort has been made to address this concern and is discussed in the cover article.
Also, interpreting results is made more difficult because of the inability to know the conjectured alternative—what would have happened if Wal-Mart had not come to town? Under normal scientific protocols, a control group mirroring the study group would be constructed to investigate the absence of Wal-Mart. In this case, the fedgazette used a pool of 49 counties within the Ninth District that had no Wal-Mart and had a population range similar to the 40 Wal-Mart counties being studied (10,000 to 40,0000). However, readers should understand that this is not a truly scientific control group and, as such, cannot be said to represent county outcomes where Wal-Mart is absent.
Finally, a significant amount of additional analysis was done to test the robustness of the findings described in the cover article. For virtually all findings discussed, different data sets, time periods or subsets of counties were also analyzed to see if the original findings were sensitive to obvious, but unseen, differences among the Wal-Mart and non-Wal-Mart county study groups. For example:
- 11 counties with supercenters by 2003 were investigated separately, and results in this subgroup differed little compared to all Wal-Mart counties.
- Findings for income, employment and earnings were back-tested against Beale codes, a seven-point continuum from the U.S. Department of Agriculture indicating a county's population density from rural to urban. This was done to identify any potential biases of population or proximity to urban areas among Wal-Mart and non-Wal-Mart counties. Beale code results were slightly more favorable to Wal-Mart.
- Separate analysis was also done with the 18 counties in the comparison group with populations over 20,000 in 1985, which made it a closer comparison group (in terms of population) to Wal-Mart counties. As with other checks of robustness, there were slight differences in the degree of change, but overall results were unchanged.
- Changes to employment were also rerun using County Business Pattern data from the U.S. Census Bureau, which produced qualitatively the same results as data from the Bureau of Economic Analysis.
Wal-Mart Expansion in the Ninth District
(All Counties including metro)
1986-1990
1991-1995
1996-2000
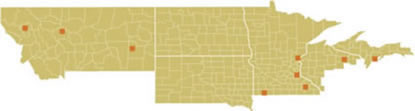
2001-2005
Ron Wirtz is a Minneapolis Fed regional outreach director. Ron tracks current business conditions, with a focus on employment and wages, construction, real estate, consumer spending, and tourism. In this role, he networks with businesses in the Bank’s six-state region and gives frequent speeches on economic conditions. Follow him on Twitter @RonWirtz.


