Author


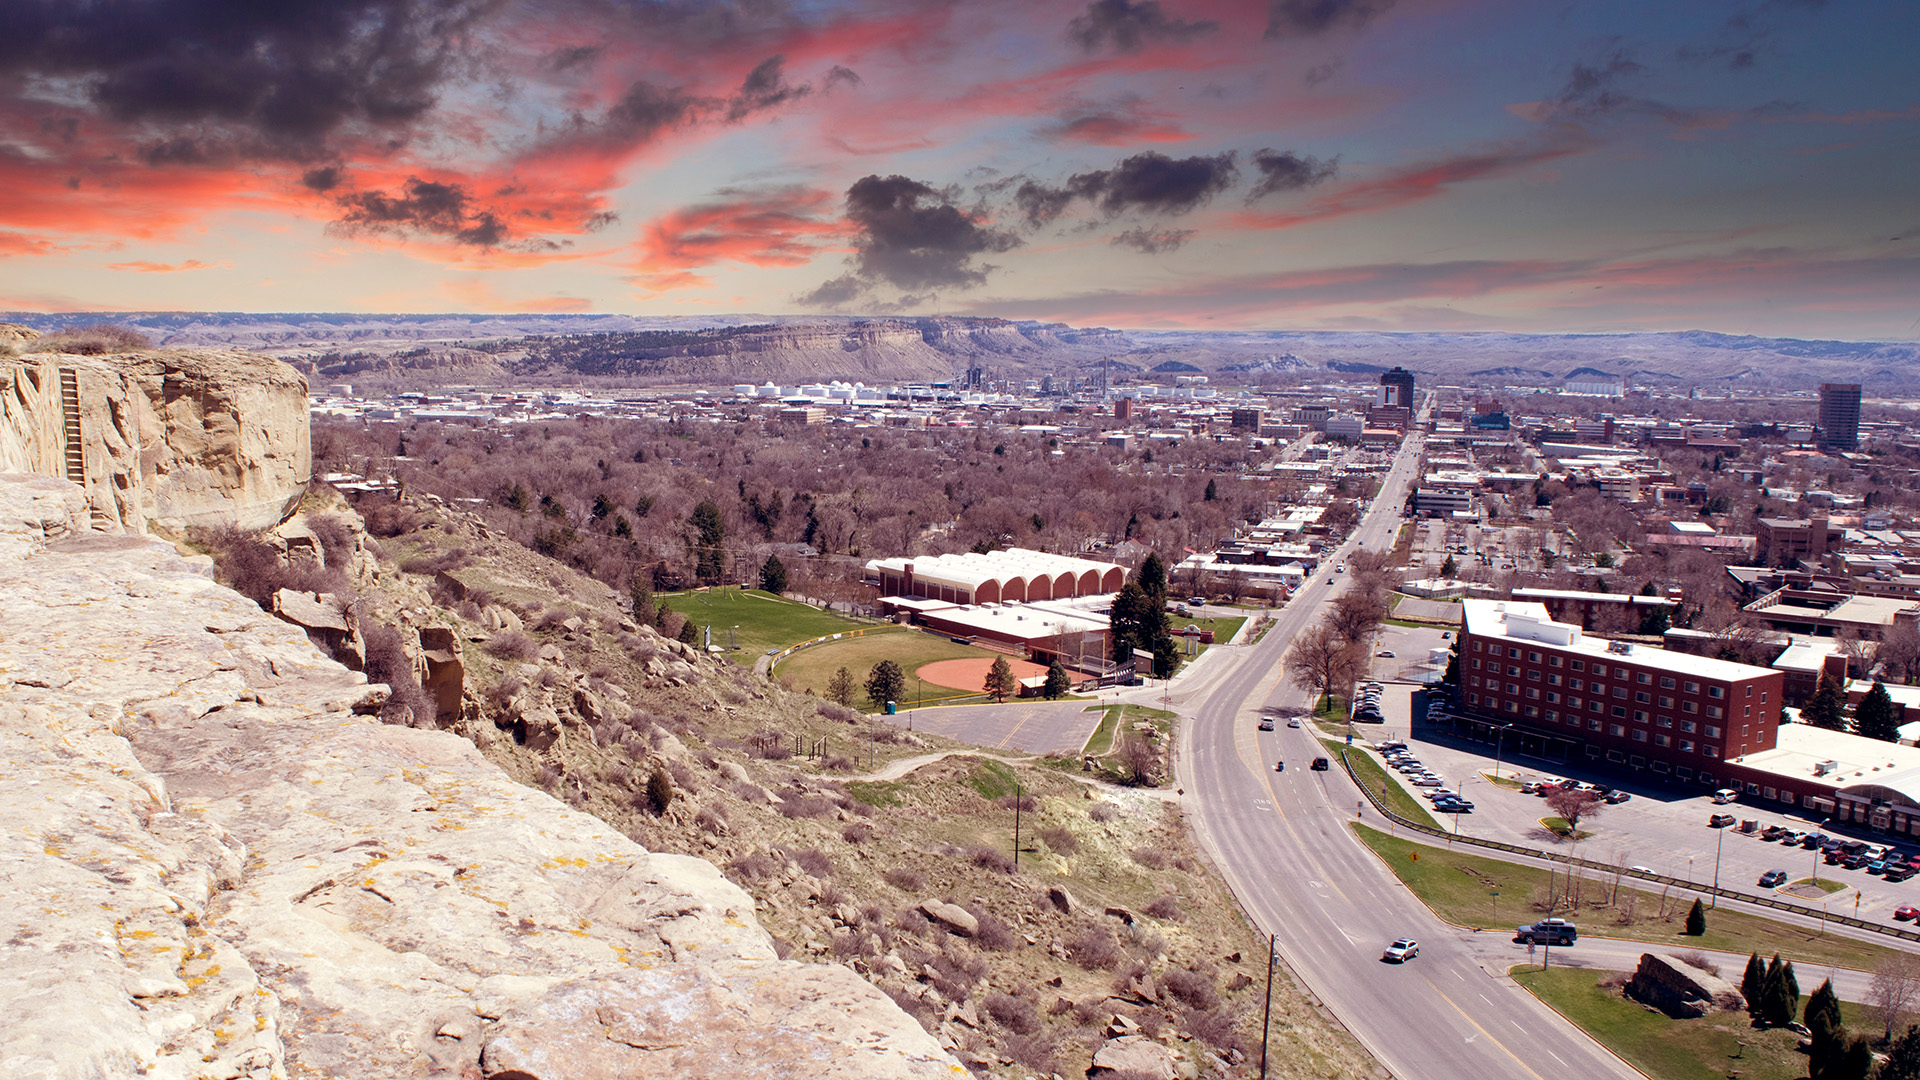
The Billings, Montana, metropolitan statistical area (MSA) stretches over about 4,700 square miles, which is roughly the size of Connecticut. The MSA includes three counties—Yellowstone, Carbon, and Golden Valley—and 38 census tracts. At the time of the 2010 U.S. Census, it was the 46th-largest MSA in the U.S. in land area and the 250th-largest in population. The U.S. Census Bureau currently estimates that about 168,000 people live in the Billings MSA, with about two-thirds of them living in the City of Billings. Over the past ten years, the rate of population growth in Billings has exceeded the rate of growth in the state and nation.
The combination of a relatively large geographic footprint and relatively small population makes it one of the least-dense metro areas in the nation. It is roughly the same geographic size as the MSAs that include Memphis or Philadelphia, while its population is similar to that of the MSAs containing Bend, Oregon, or Eau Claire, Wisconsin.
Community leaders reported a smaller impact from the Great Recession on employment and housing prices in Billings compared with many other parts of the country. These observations are supported by the region’s unemployment rate, which was persistently lower than those of the state and the nation,1 and its labor force participation rate, which has also outperformed the state and nation.2 See figures 1 and 2.
Other regional economic indicators also reveal positive regional performance. For example, see figure 3, which shows that post-Great Recession home price appreciation in Billings was stronger than in the state of Montana or the U.S. as a whole. The overall poverty rate in Billings is about 10.2 percent, lower than the national rate (14.6 percent) and statewide rate (14.4 percent). Poverty rates in Billings are significantly higher for children under age five (17 percent) and American Indian residents (27 percent) when compared to the overall Billings population.3
Low- and moderate-income areas in Billings
The Community Reinvestment Act (CRA) is a federal law enacted in 1977 that is intended to encourage depository institutions to help meet the credit needs of the communities in which they operate, including low- and moderate-income (LMI) neighborhoods,4 consistent with safe and sound banking operations.5 The regulations that implement the CRA are geography-based; that is, they define specific geographic areas in which activities can qualify for consideration under the CRA.
Of the 38 census tracts that make up the Billings MSA, 10 are moderate-income under the CRA definition and 1 is low-income.6 See the table below. These low- and moderate-income census tracts account for almost a quarter of the population and, relative to the rest of Billings, have higher rates of poverty, lower median credit scores, and lower rates of health insurance coverage, high school graduation, and homeownership. Renter households are less housing-cost-burdened in moderate-income census tracts compared to other parts of Billings.
| Income category | Number of tracts |
Population | Labor force participation rate | High school graduate or above | Share of families in poverty | Median Equifax risk score (Q2 2019) |
|---|---|---|---|---|---|---|
| Low | 1 | 3,999 | 56.6% | 85.5% | 19.1% | 700 |
| Moderate | 10 | 36,710 | 68.7% | 90.5% | 15.7% | 710 |
| Middle | 22 | 98,679 | 68.6% | 93.4% | 8.5% | 755 |
| Upper | 5 | 28,157 | 62.4% | 95.9% | 5.9% | 778 |
| Income category | Share of renter households that are housing-cost-burdened |
Share of households that have no health insurance | Share of households that own their home |
||
|---|---|---|---|---|---|
| Low | 49.1% | 32.8% | 36.3% | ||
| Moderate | 40.9% | 15.0% | 55.9% | ||
| Middle | 45.2% | 8.6% | 72.1% | ||
| Upper | 55.2% | 6.7% | 79.9% | ||
| Sources: Author’s calculations using data from the 2017 U.S. Census Bureau American Community Survey 5-Year Estimates and Q2 2019 credit history data from the Federal Reserve Bank of New York Consumer Credit Panel/Equifax Data | |||||
Endnotes
1 U.S. Bureau of Labor Statistics, Unemployment Rate in Billings, MT (MSA) [BILL730URN]; retrieved from FRED, Federal Reserve Bank of St. Louis, in August 2019.
2 U.S. Census Bureau, Employment Status: 2013–2017: American Community Survey 5-Year Estimates.
3 U.S. Census Bureau, Poverty Status in the Past 12 Months: 2013–2017 American Community Survey 5-Year Estimates.
4 Low income refers to a census tract with a median family income that is less than 50 percent of the area median income. Moderate income refers to a census tract with a median family income that is at least 50 percent and less than 80 percent of the area median income. For more information on how the CRA defines these terms, see the 2018 Community Dividend feature, “Defining ‘low and moderate income’ and ‘assessment area.’”
5 Regulation BB (Community Reinvestment Act), Code of Federal Regulations, Title 12, §228.11. The text of the regulation is available online at www.ecfr.gov.
6 As reported by the Federal Financial Institutions Examination Council Census Portal.