The price of a home loan affects every aspect of a home buyer’s financial life, from living standard to budget to retirement savings. For many borrowers, the interest rate and other costs affect whether they can even become homeowners in the first place. As Native communities grapple with housing challenges, the high cost of loans to Native American borrowers is one important part of the story.
New research from the Center for Indian Country Development digs deeper into the reasons why Native American borrowers pay more for home loans than White borrowers on average. We find that for Native American borrowers, either living on or off reservations, the price disparity can largely be explained by heavy reliance on home-only loans—that is, personal property loans used to purchase manufactured homes—and not by underwriting or demographic characteristics, such as credit scores or incomes. The discrepancy in home-only-loan reliance likely stems from the lack of low-cost mortgage options available to prospective home buyers in those areas and hard-to-measure factors such as diminished access to generational wealth.
To explore these issues, we worked with data collected through the Home Mortgage Disclosure Act (HMDA), a federal law that requires many financial institutions to report detailed information on their loan applications. HMDA data include approximately 88 percent of the estimated total number of home loan originations in the United States. Our analysis focused on all HMDA-reported residential loans for single-unit properties approved from 2018 through 2021—a total of approximately 4.5 million loans. We looked at differences among three groups of borrowers: Native Americans living on reservations, Native Americans living off reservations, and White borrowers.1
Native Americans pay more for home loans than White borrowers on average
To explain one measure of loan price, we examined the interest rates of loans in the HMDA data. As detailed in our related working paper, we find that interest rates on loans to Native Americans on reservations are on average 143 basis points (or 1.43 percentage points) higher than interest rates on loans to White borrowers. Interest rates are also higher on average for Native American borrowers off reservations relative to White borrowers, but by a substantially smaller margin of 12 basis points (or 0.12 percentage points). For borrowers on reservations, we observe a disparity at each percentile of the interest rate distribution, as shown in Figure 1. Among the most expensive loans—in the top 10 percent of the interest rate distribution—Native American borrowers on reservations paid almost two times more than White borrowers.2
Underwriting differences alone don’t explain the price gap
Our findings raise the question: What drives the price gap? To explore this, we looked at whether differences in individual borrower characteristics that are important considerations in the underwriting process—such as credit scores, incomes, and loan amount—could explain the higher cost of loans to Native Americans, and particularly to those on reservations. Compared to White households located in states with federally recognized reservations, both on-reservation and off-reservation Native American borrowers have lower incomes, experience lower credit scores, and receive smaller loans. For example, the average loan amount originated for White borrowers is $390,000, approximately two and a half times larger than the average loan amount of $160,000 for Native American borrowers on reservations and approximately one and a half times larger than the $270,000 average loan amount for Native American borrowers off reservations.
However, these underwriting differences explain only part of the interest rate gap. We find that adjusting for basic underwriting and demographic characteristics—including age, gender, income, credit score, loan amount, property value, and whether the loan was federally insured or guaranteed—explains only 13 percent of the interest rate gap between Native American borrowers on reservations and White borrowers. On the other hand, these factors explain much more of the gap—nearly 35 percent—between Native American borrowers off reservations and White borrowers. Put together, we find little evidence that borrowers are sorting into low- or high-cost home loans based on such factors as their credit score.
If it’s not individual borrower characteristics, what does drive the gap for Native American borrowers on reservations?
Disproportionate use of home-only loans on reservations largely drives the gap
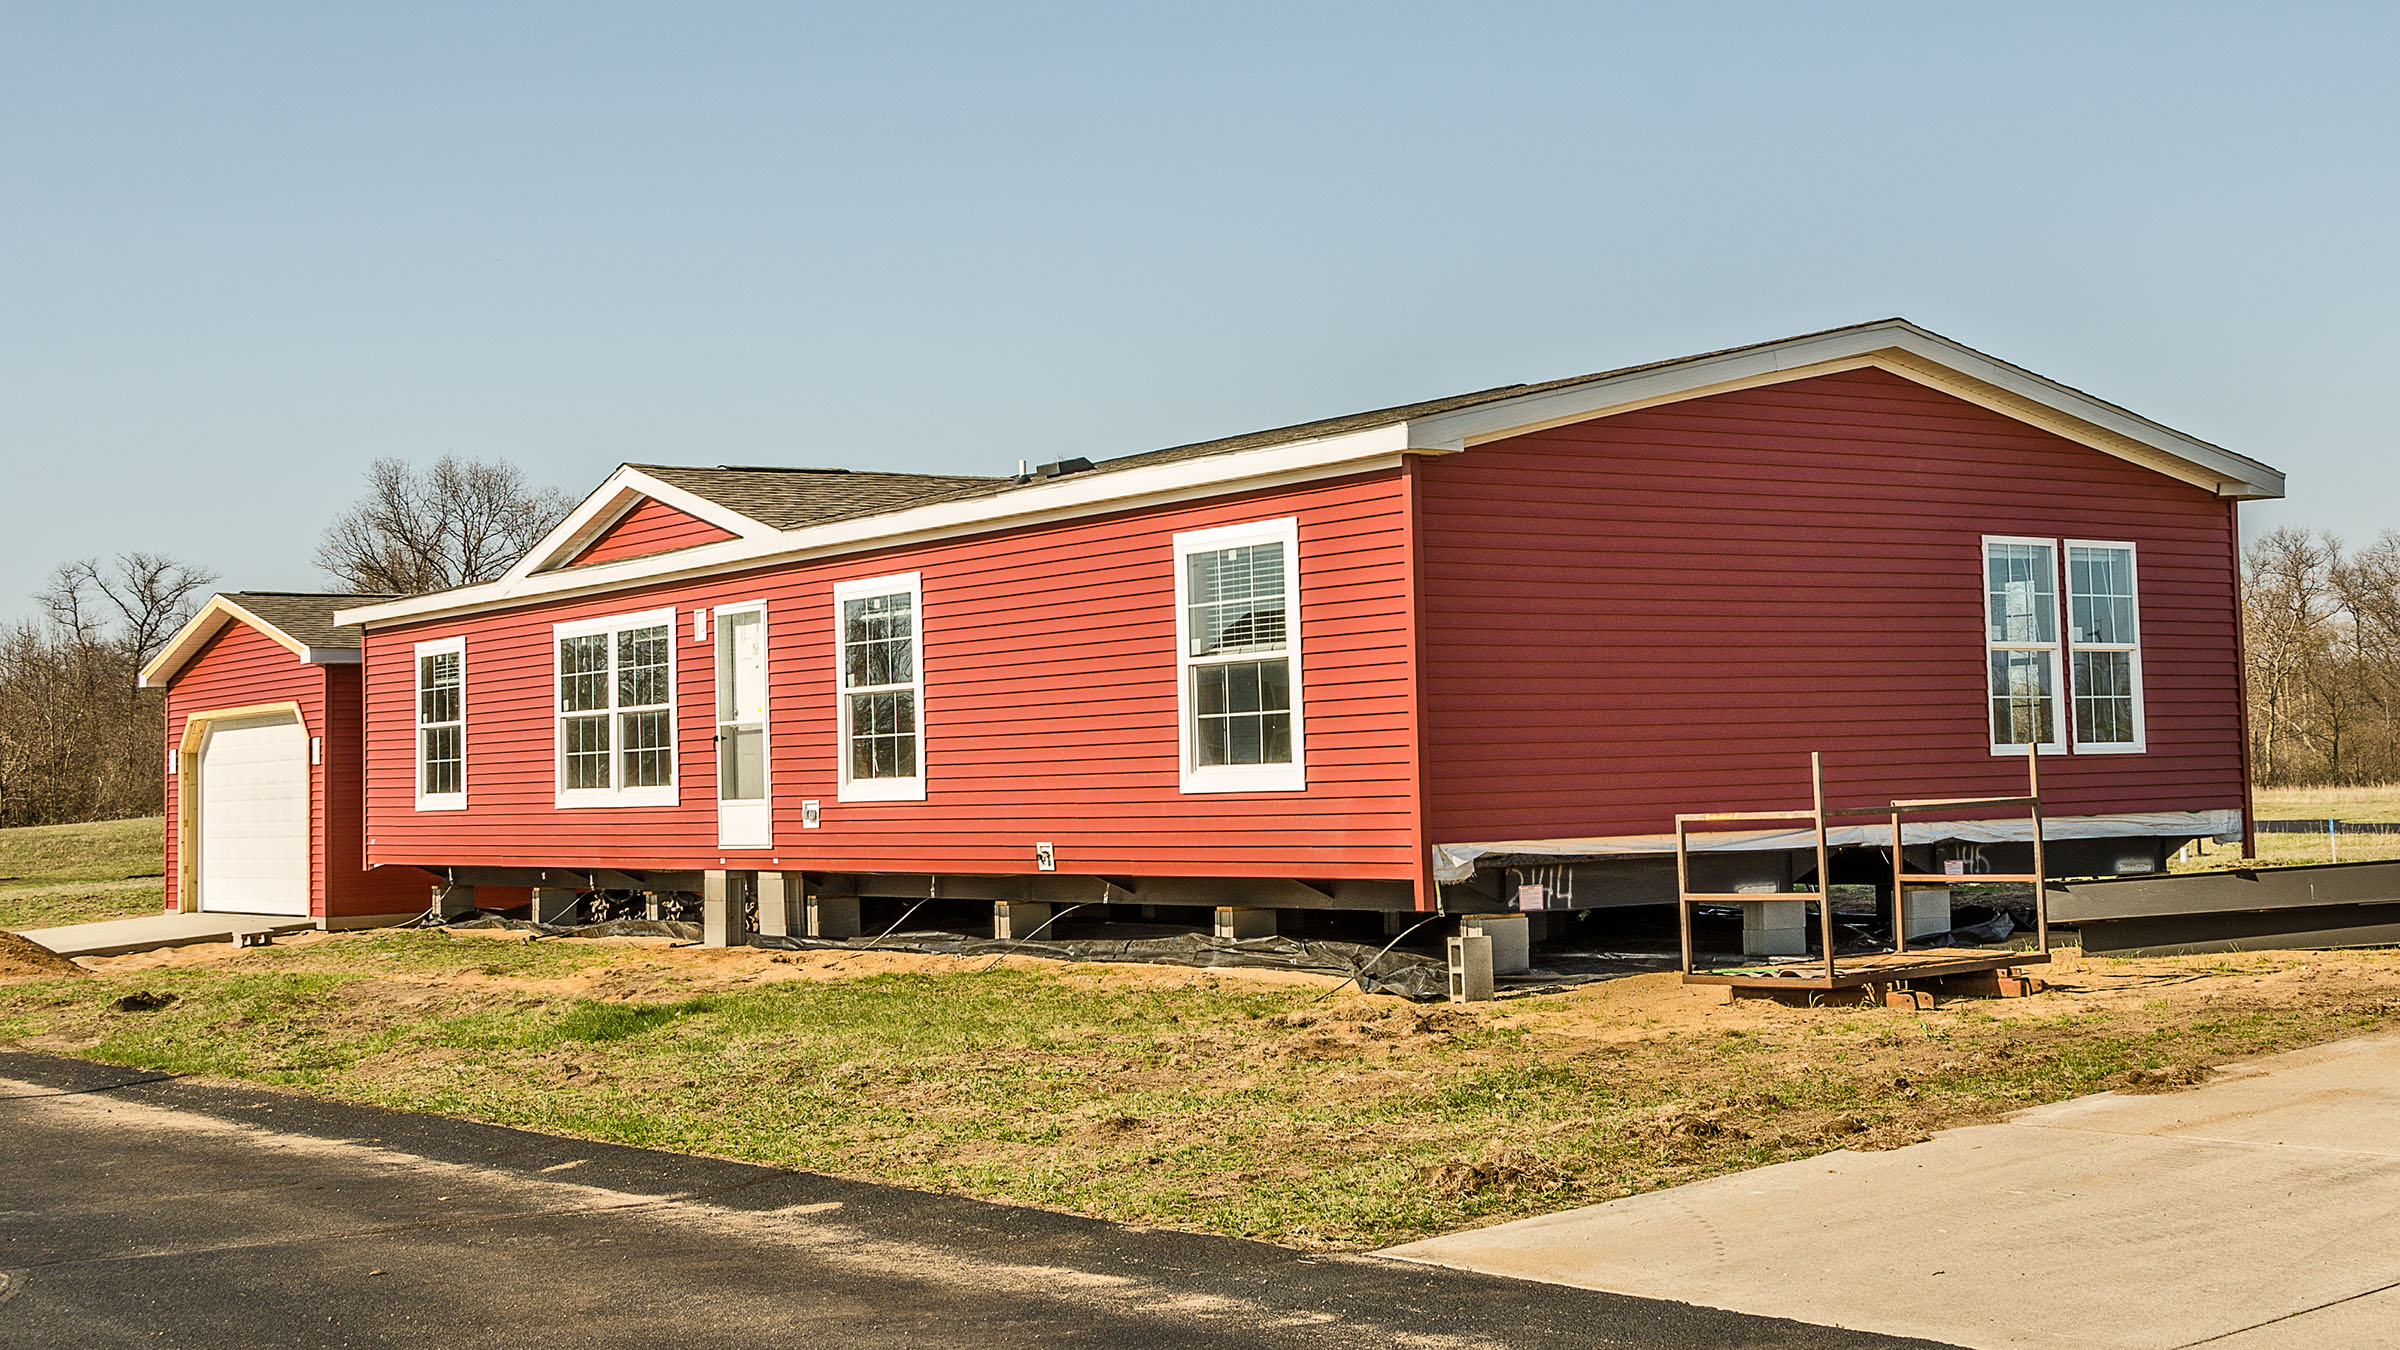
When we looked at differences in the type of loan, we found that almost all of the price difference between loans to Native American borrowers on reservations and comparable loans to White borrowers was explained by the disproportionate use of home-only loans on reservations. Home-only loans are a type of personal property loan, like car loans, and are not tied to real property.3 Home-only loans can only be used for manufactured homes, but—importantly—not all manufactured homes need to be financed with home-only loans.4 Home-only loans are often issued by non-bank lenders and, with limited exception, are ineligible to be federally insured or guaranteed.
As seen in Figure 2, when we accounted for the effect of home-only loans, we found that about 75 percent of the price gap between Native American borrowers on reservations and White borrowers could be explained by whether the loan was for a mortgage or a home-only loan. Approximately 10 percent of the interest rate gap between Native American borrowers on reservations and White borrowers could not be attributed to differences in underwriting characteristics and home-only-loan status. We found a similar story for Native American borrowers off reservations. In that case, approximately 65 percent of the loan price gap could be attributed to higher reliance on home-only loans.
Why are home-only loans so common in Indian Country?
Nearly 40 percent of loans to Native American borrowers on reservations were for manufactured homes, compared to 3 percent of loans to White borrowers. On reservations, most of those manufactured-home loans—approximately eight out of 10—were home-only loans. Native American borrowers on reservations were 34 times more likely to use a home-only loan than White borrowers and 10 times more likely to use a home-only loan than Native American borrowers off reservations. Understanding the high prevalence of home-only loans among Native American borrowers, especially those on reservations, requires more data.
We can say that the higher prevalence of home-only loans on reservations cannot be attributed to differences in credit scores. As Figure 3 shows, while borrowers with high credit scores were less likely to take out home-only loans, we found many Native American borrowers on reservations who had home-only loans and high credit scores. Even the most creditworthy Native American borrowers on reservations received home-only loans at much higher rates than the other groups.
We also found that the higher prevalence of loans for manufactured homes on reservations did not explain the disproportionate use of home-only loans in those areas. Even looking at only manufactured-home purchasers, we found that Native American borrowers on and off reservations were more likely to have home-only loans.
We also considered the fact that much of the land on reservations is held in trust by the federal government. Due to ownership complexities related to trust land, Native American borrowers of newly originated loans on reservations are less likely to directly own the land where the home sits. However, even when a tribal member does not hold legal title to land, a manufactured home can still be tied to the land through a leasehold mortgage or a trust land mortgage. In other words, the higher prevalence of home-only loans on reservations does not necessarily result from living on trust land. When we controlled for whether the land where the home sits is leased or directly owned, differences in property interests alone did not explain the differences in home-only-loan prevalence. Native American borrowers on reservations were 29 percentage points more likely to apply for a home-only loan compared to White borrowers living in the same county—even when controlling for property interests.
We did find smaller disparities in approval rates for home-only loans than for manufactured-home mortgages, which could encourage borrowers to pursue home-only loans. However, home-only loans have a high overall rejection rate, so the relative advantage in approval rates for Native American borrowers is unlikely to explain the relatively high use of home-only loans.
Future avenues for research
Our analysis identified that the higher prevalence of home-only loans to Native Americans largely drives the fact that they pay higher loan prices, but more research is needed to understand why home-only loans are disproportionately used on reservations. Even after controlling for a variety of borrower and loan characteristics, a large portion of the difference in home-only-loan prevalence remains unexplained.
One possible explanation is that Native Americans living on reservations tend to have fewer financing options. Historically, tribal areas have been underserved by mainstream financial institutions. Other research suggests that many manufactured-home buyers who end up with home-only loans do not start the loan process with a preference for a home-only loan, indicating the gap can’t be explained by borrowers’ initial preferences. In recent years, Native CDFIs (Community Development Financial Institutions) have helped address the credit gap in Indian Country by providing affordable loan products and culturally tailored financial services. Some seasoned Native CDFIs have started to provide mortgages, helping to address the mortgage scarcity on reservations that the HMDA data suggest.
There is also evidence that conventional mortgage lenders are reluctant to issue mortgages on trust land. The federal government has created several lending products to encourage lending specifically to Native Americans, but past research indicates that mortgage products meant to spur homeownership on trust land have not permeated Indian Country. Our results also suggest a gap in mortgage loans to Native Americans who live on reservations and have direct ownership of the land. Other potential factors, difficult to measure, include gaps in financial literacy stemming from a lack of generational wealth, high construction costs on reservations making it costly to build a permanent foundation for a manufactured home, a relatively small stock of available homes, predatory lending practices, and discrimination.
Given the significant housing challenges that many Native Americans experience, unpacking the reasons behind the disproportionate use of home-only loans in tribal areas is an important direction for future research.
Appendix: About the data
HMDA requires financial institutions that surpass a specific number of mortgage loans or open lines of credit to disclose detailed information to regulators on each loan application. HMDA is one of a group of landmark federal laws from the 1960s and 1970s known as fair lending laws. They were created to ensure access to credit for people belonging to certain protected classes. HMDA data cover approximately 88 percent of all home loan originations in the United States, including loans from large-scale mortgage lenders, manufactured-home specialty lenders, and most banks. Native CDFIs and tribally owned banks are not required to report under HMDA. However, past research suggests that, despite gaps in HMDA’s coverage, HMDA data provide useful information on lending on reservations.
Since 2018, HMDA data have included several new variables integral to our analysis. These include the borrower’s credit score, the rate spread on the loan for all prices of loans,5 and other underwriting variables such as loan-to-value ratios. HMDA data also now include information on whether a manufactured-home loan is tied to a home only or to the home and land, and whether the borrower has direct ownership or leasehold property interest where the home sits. The Federal Reserve has privileged access to confidential HMDA data that contain borrowers’ credit scores at the time of their loan applications.
Our analysis focused on residential loans issued from January 1, 2018, through December 31, 2021, for single-unit properties whose primary borrower was either American Indian or Alaska Native (AIAN) or White, based on the borrower’s self-reporting on their loan application or the loan officer’s categorization of the borrower. A borrower was identified as AIAN (referred to as Native American in our article) if AIAN was listed for one of the five race fields. White borrowers in this analysis are those for whom White was listed as the primary race with no other races listed. Our analysis also controlled for the presence of a co-borrower.
HMDA data provide information on the census tract where the home sits. Since census tract boundaries do not perfectly align with reservation boundaries, we assigned homes to on- vs. off-reservation categories based on the percentage of a census unit’s area that overlaps with American Indian reservation or off-reservation trust land. To determine a rule for assigning census tracts to on- vs. off-reservation areas, we mapped the property addresses from a small set of HMDA-reported loans on reservations. Based on this subset of loans, we determined that at least 60 percent of a census tract’s area needed to overlap with federally recognized reservation land in order to assign a borrower to the reservation category. However, the vast majority of census tracts in our analysis fell almost entirely within or almost entirely outside of reservation areas, making our assignment rule largely unnecessary.
Endnotes
1 In the context of this research, Native American refers to borrowers identified in the HMDA dataset as American Indian or Alaska Native. See our Appendix section for more on this categorization.
2 To illustrate the significance of these loan prices, consider the following: For a $75,000 home loan over a 23-year period (that is, the most common term length for a home-only loan), Native American borrowers at the 90th percentile of interest rates (an approximately 9 percent interest rate) would end up paying more in interest than the principal borrowed—approximately $100,000 in interest—by the time the loan matures. For White borrowers at the 90th percentile (an approximately 5 percent interest rate), financing a loan of the same size would cost about $50,000 in interest—approximately half the amount of interest—over the life of the loan.
3 Real property generally refers to land and the buildings and fixtures permanently attached to land, in contrast to personal property (that is, movable items) such as cars, furniture, and equipment.
4 Depending on the circumstances, a manufactured-home purchase may be financed with either a manufactured-home mortgage or a home-only loan. While home-only loans enable buyers to avoid what can be a cumbersome process for securing a manufactured-home mortgage, they carry fewer consumer protections, have higher interest rates, and are rarely refinanced. They are sometimes referred to as “chattel loans.”
5 Rate spread is the difference between a loan’s annual percentage rate, or APR, and the average APR offered for prime loans. In addition to our analysis described here, which uses interest rates as its measure of loan price, our working paper includes an analysis that uses rate spread as its loan-price measure.
Matthew Gregg is a senior economist in Community Development and Engagement, where he focuses on research for the Center for Indian Country Development. He has published work on historical development in Indian Country, Indian removal, land rights, and agricultural productivity.


