Authors


Recently, a team from the Minneapolis Fed spent a week in Billings, Montana, and on the nearby Crow Reservation talking with a range of public and private stakeholders to improve our understanding of the region’s community conditions and community development sector. When asked about the barriers to economic mobility for low- and moderate-income Billings-area residents, these stakeholders frequently cited a lack of affordable housing options.
Lower-income renters face challenges in finding affordable housing in Billings. Overall, about two-fifths of the renters in the three-county Billings metropolitan statistical area (MSA) are housing-cost-burdened, which means they spend at least 30 percent of their gross income on housing expenses. Among lower-income renters, however, three-quarters are housing-cost-burdened, and roughly two-fifths are severely housing-cost-burdened, which means they spend more than 50 percent of their gross income on housing.1 Billings has a numerical shortage of rental units affordable to extremely low-income households. It also has higher-income households living in lower-cost units, which exacerbates affordability challenges for lower-income renters.
The Billings metro at a glance
The Billings MSA includes Yellowstone, Carbon, and Golden Valley counties and is home to more than 171,000 people, or nearly 1 in 6 Montana residents. Yellowstone County itself has more than 160,000 residents.2 (Unless noted otherwise, all data on Billings in this article refer to the full, three-county Billings MSA.)
Explore more from Billings
Read additional features inspired by the Minneapolis Fed’s recent conversations in the Billings region:
What we learned on a community engagement trip to Billings
Billings community data profile
Understanding the CRA performance context
In Billings, early care market may be an economic-mobility barrier
Population growth in Billings has slightly outpaced growth in both the U.S. and its metropolitan areas. From 2010 to 2018, Billings’ population has increased by 12,300 residents, or 7.7 percent, relative to 6.9 percent for MSAs across the nation. Nearly two-thirds of this population growth in Billings has resulted from migration, largely from elsewhere in the country, and one-third from natural growth—that is, births outpacing deaths, similar to Montana’s population growth overall. 3
Like most of Montana, Billings remains largely white; 87 percent of the population is white non-Latino. The next-largest racial and ethnic groups are Native American at 5 percent and Latino at 5 percent (including, respectively, those who identify as both white and Native American and those of any race who report Latino ethnicity). The population of people of color and Native Americans in Billings has increased three times more quickly than the population of white non-Latino residents.4
A homeowning majority
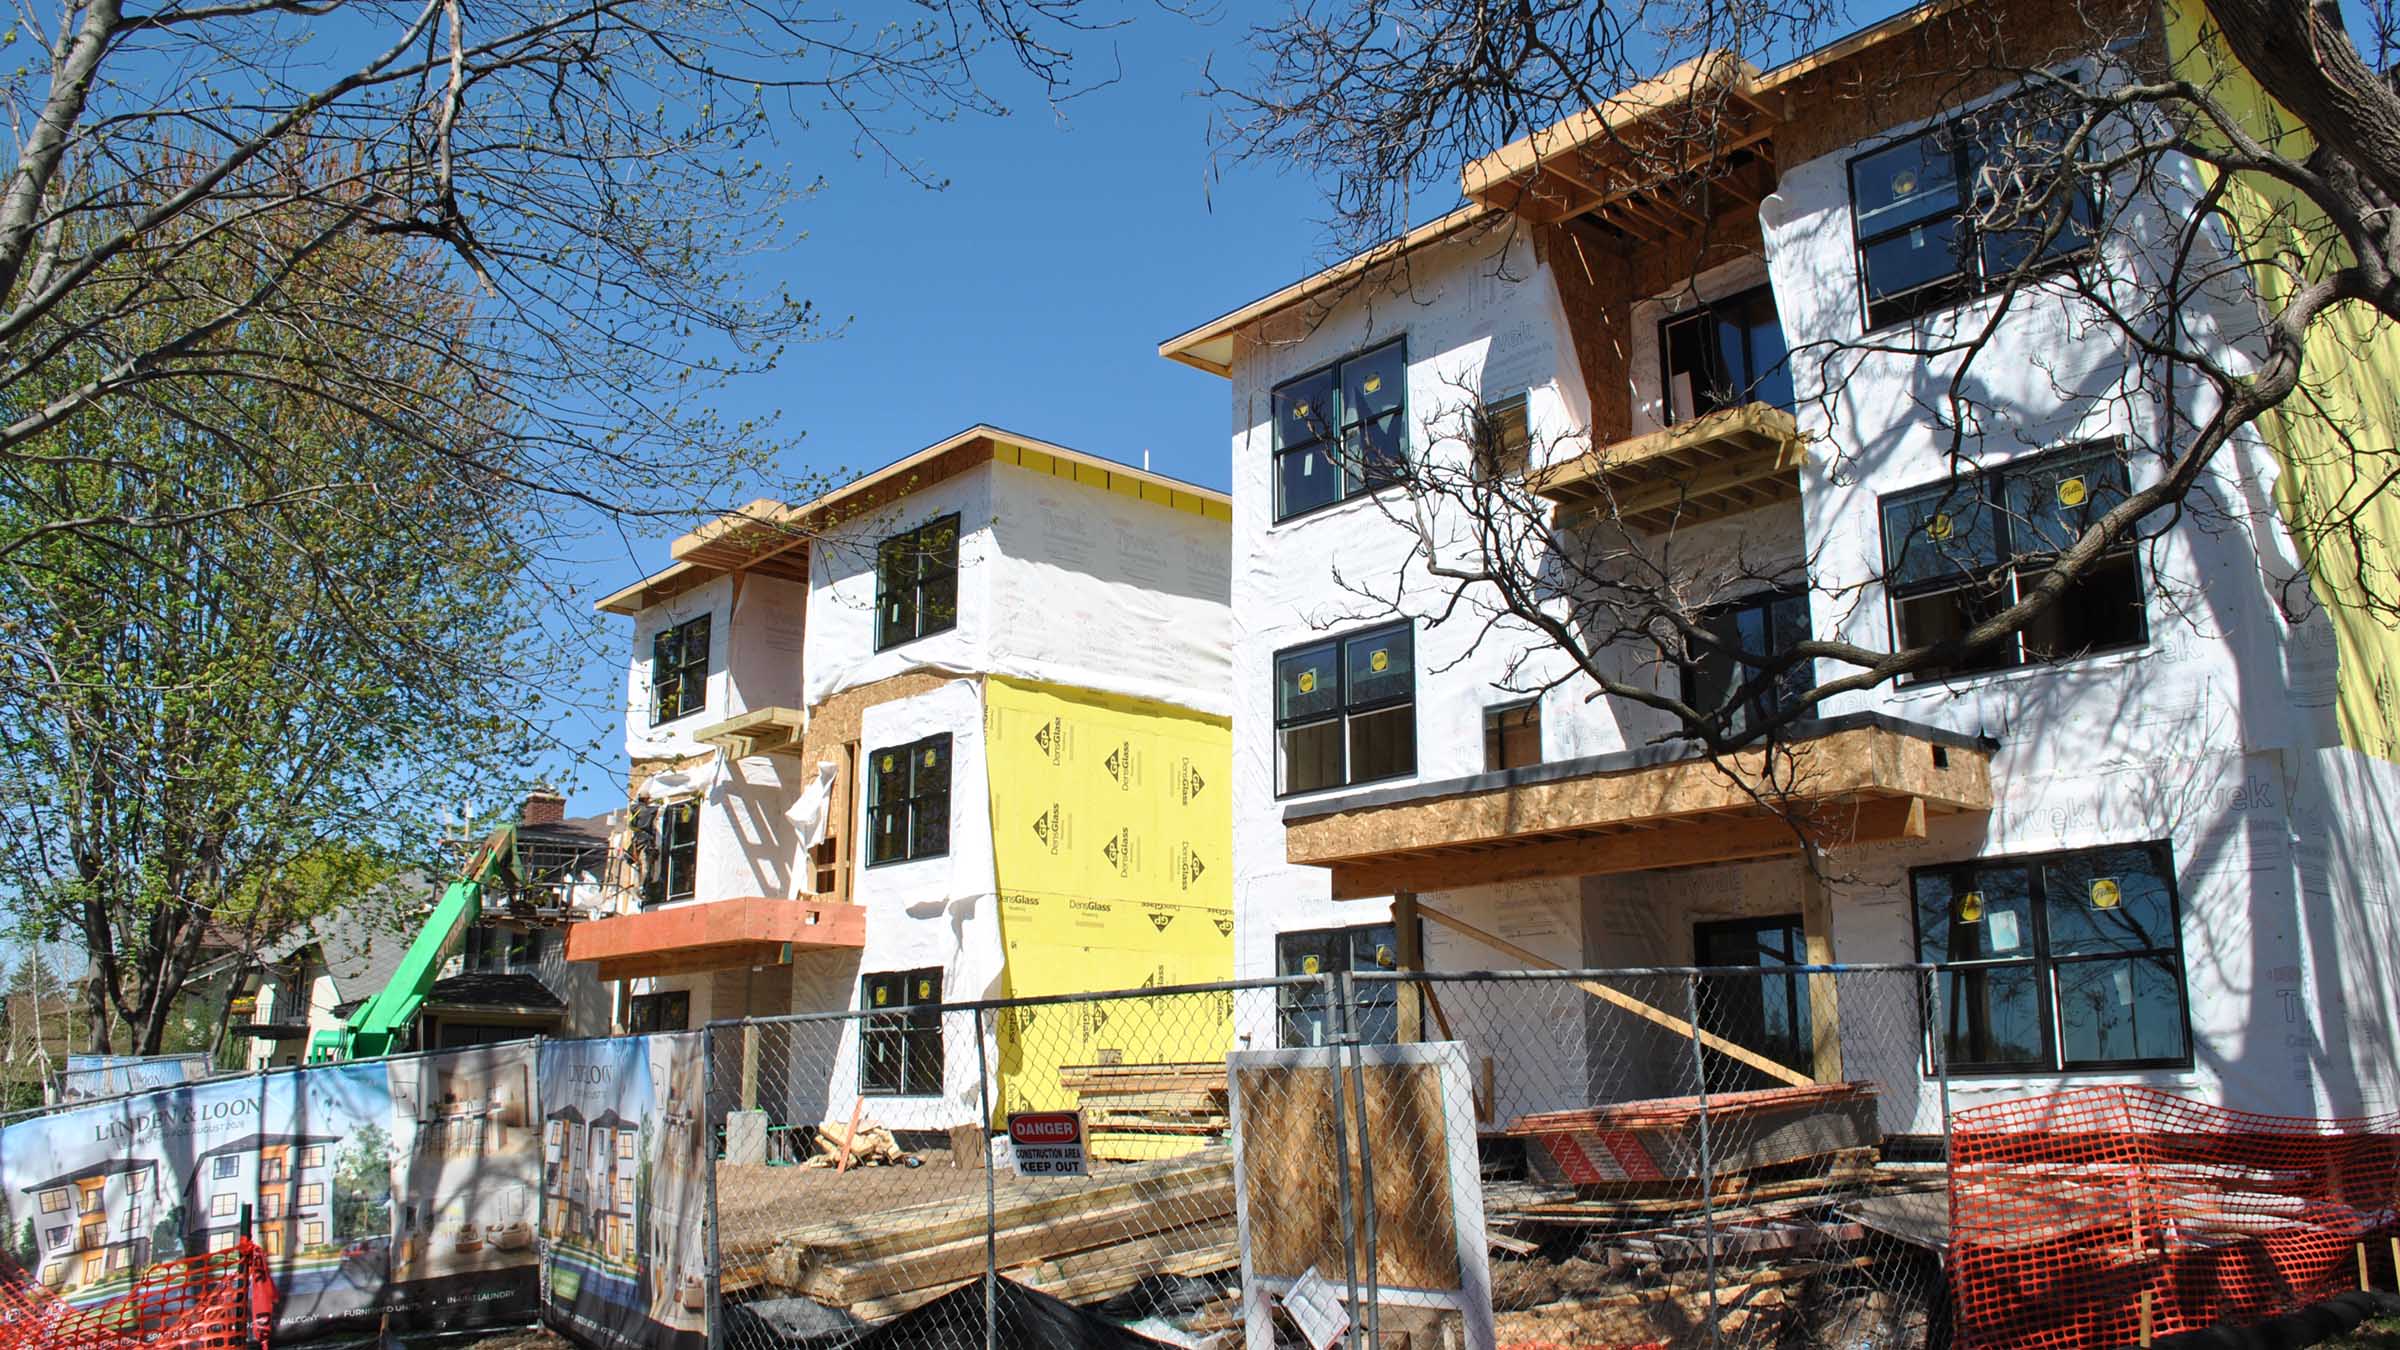
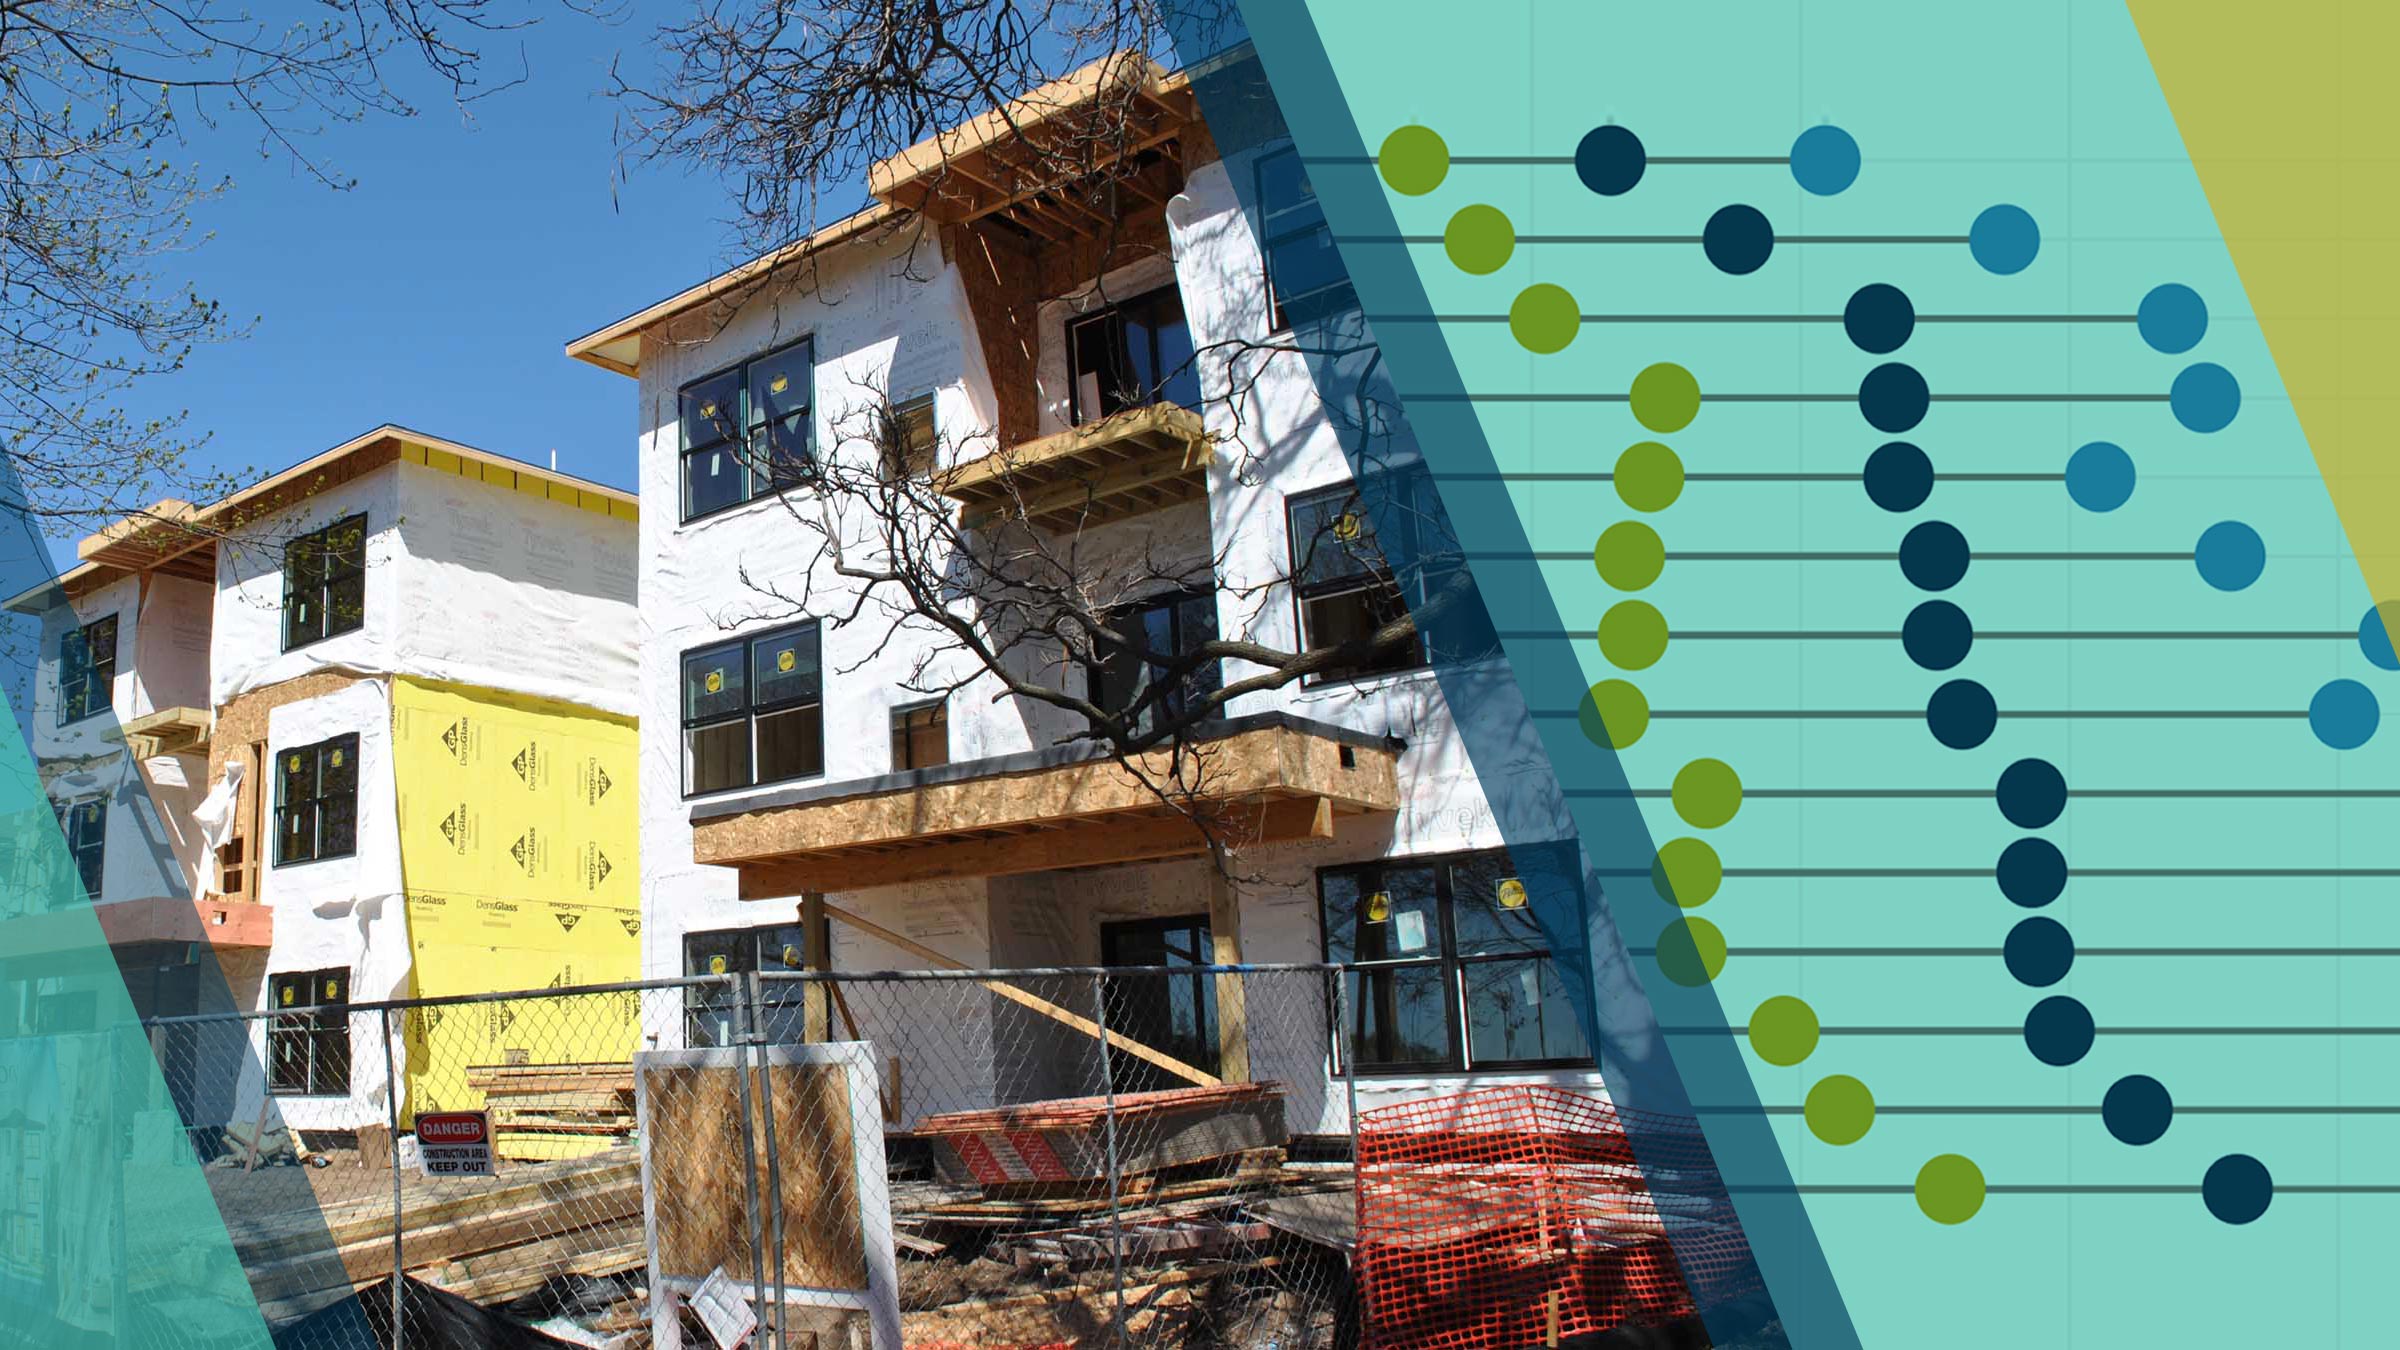
Since 2010, Billings’ housing market has produced about 8,400 units, bringing the total number of housing units to nearly 80,000. This construction represents an 11.8 percent increase in housing units, meaning that the number of housing units has increased at a slightly faster rate than population growth.5
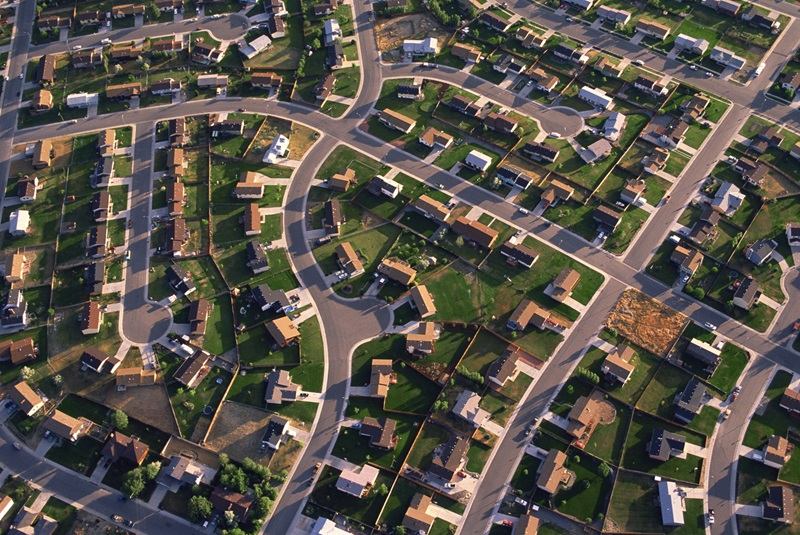
Also since 2010, the majority of new housing units in Billings have been single-family dwellings presumably constructed for homeownership. According to the latest data, 69 percent of Billings households are homeowners. A nearly identical share—71 percent—of new units constructed since 2010 are single-family dwellings, largely reinforcing the existing distribution of owner-occupied and rental units.6
Home prices outpace incomes
Homeownership rates in Billings have been stable at 69–70 percent over the last decade.7 Residents of color and Native Americans are less likely to be homeowners than white residents; more than 70 percent of white non-Latino Billings residents are homeowners, compared to less than 50 percent of the area’s Native American, black, Latino, and Asian residents.8
While Billings’ creation of housing units has outpaced its population growth, prices continue to rise for homeowners. By several metrics, the growth in home prices in Billings has outpaced the growth of household incomes. For example, in 2000, the median sale price of a home in Billings was 2.7 times the median household income. In 2017, the median sale price of a home was 4.0 times the median household income.9
Prior to the Great Recession, inflation-adjusted home prices in Billings followed national trend lines. When national home prices dipped dramatically in real terms from 2006 to 2012, declines in Billings were much more modest, and prices began to rise when they did across the nation. Across all markets, a home in the U.S. now costs 25 percent more than it did in 2000 in real terms. By comparison, a home in Billings now costs 50 percent more than it did in 2000.10 (For an illustration of this, see Figure 3 of our Billings community data profile.)
Despite these price increases, the median price of a home sold recently in Billings would result in a monthly payment that is affordable for 87 percent of the metro’s homeowner households.11 However, 1 in 5 homeowners is paying more than 30 percent of income on housing costs.12
A snapshot of residents who rent
Three in ten households in Billings rent their homes. These renting households are more racially and ethnically diverse and have lower incomes than homeowners in Billings. One in seven renting households is headed by people of color or Native Americans, compared with only one in eighteen homeowning households. While more than one in four renting households include children under 18, about half of renting households are made up of individuals living alone or unrelated individuals sharing a household.13
While many Billings residents use renting as a point of transition—for example, 3 in 5 people who had moved within the last year moved into rental housing—there is also stability among renting households. As of the most recent census data, 7 in 10 residents of renter-occupied housing units lived in the same unit one year previously.14
Among households of all sizes, the median household income of renters in Billings is $35,200 per year, about half the $70,000 median household income of homeowners. Renters’ lower incomes limit their ability to pursue homeownership and find rental units that are affordable. As a result of rising home prices and the lower income of renters, only 27 percent of the area’s renter households could afford the median price of homes sold recently in Billings.15 Median gross rent—that is, the median cost of rent plus utilities—has been increasing slightly faster than the median household income of renters, up 26.5 percent from 2010 to 2017 (not adjusted for inflation) relative to 22.8 percent over the same time period.16
Billings residents who earn the median renter household income of $35,200 can afford to pay the median gross rent—$822—without paying more than 30 percent of their income on housing; the 30-percent dollar figure that signifies a cost-burdened household is nearly $60 higher, at $879 a month.17 However, this illusion of balance masks some key distributional issues affecting low- and moderate-income renters.
A shortage, or a mismatch?
The share of renting households that are paying more than 30 percent of their income on housing has edged up from 38 percent to 41 percent; 1 in 5 is paying more than 50 percent of income on housing costs.18
Cost burden is significantly higher among lower-income households. Among extremely low-income households, 4 in 5 are paying 30 percent or more of their income on housing. Among very low-income households, 3 in 4 are paying 30 percent or more of their income on housing.
| Income Category | Share of median family income earned | Income for a family of four in 2019 |
|---|---|---|
| At median family income | 100% | $79,200 |
| Very low-income | 50% | $39,150 |
| Extremely low-income | 30% | $25,750 |
For extremely low-income renting households, Billings has a shortage of affordable rental units. The MSA has 4,700 households that earn extremely low incomes, but only 2,900 units with rents affordable to these households. This gap is exacerbated by relatively higher-income households that occupy half of these units. As a result, only 3 in 10 extremely low-income households are paying rents in line with affordability standards for their income. (See the table below.)
For lower-income renters with more resources, the Billings MSA has “enough” affordable units but faces an allocation mismatch. As in many regions around the country, many Billings households enjoy lower rents than what the 30-percent-of-income standard categorizes as affordable to them.
The MSA has 4,200 very low-income households and nearly 8,000 units with rents affordable to them, plus 3,000 units available at rents affordable to the extremely low-income households described previously. However, nearly half of the units that are affordable to very low-income or extremely low-income households are occupied by higher-earning households, including households earning more than the median family income. In other words, for very low-income or extremely low-income households, housing cost burden results less from a shortage of rental units and more from a misalignment of rental units.
| Number of households in rental units, by housing unit affordability level | |||||
| Extremely low-income |
Very low-income | Low-income | Moderate-income | ||
|---|---|---|---|---|---|
| Household income | |||||
| Extremely low | 1,453 | 1,878 | 1,174 | 225 | |
| Very low | 519 | 2,123 | 1,237 | 289 | |
| Low | 469 | 2,112 | 2,184 | 355 | |
| Moderate | 182 | 644 | 1,130 | 119 | |
| Greater than median | 250 | 1,228 | 2,715 | 864 | |
There are warning signs that the mismatch between renter incomes and available rental housing may get worse. The Joint Center for Housing Studies of Harvard University defines low-income households in the U.S. as those earning $32,000 a year or less. This definition captures about half of the renter households in Billings. Using the cost-burden definition of affordability, affordable housing for a household earning $32,000 costs $800 per month or less. From 2011 to 2017, the number of low-income renter households (that is, with incomes less than $32,000 in 2017 dollars) increased from 10,700 to 11,200, while the number of rental units costing up to $800 per month (in 2017 dollars) decreased from about 16,900 to 14,700.19
Mitigating the impact
Since the early 1990s, developers have used the federal Low Income Housing Tax Credit (LIHTC) to construct or rehabilitate more than 1,100 units of housing that are affordable to low-income households in the Billings MSA.20 Units built using LIHTCs are generally affordable to households earning up to 50 percent (and sometimes 60 percent) of the median family income.
As a condition of receiving the tax credit equity, these units have monitoring and compliance restrictions ensuring that, unlike with naturally occurring affordable housing, the residents are low-income. (Naturally occurring affordable housing refers to residential rental properties with lower rents but no government subsidy to ensure affordable rents or limit the income of residents.) Other strategies supporting affordability are public housing and federal Housing Choice Vouchers administered through either the Billings Housing Authority (for properties located inside the City of Billings) or the District 7 Human Resources Development Council (for properties located outside the city). Demand for these resources far outstrips the supply. A recent statement from the Billings Housing Authority revealed a 7,000-applicant waiting list for its 1,152 vouchers and roughly 400 public housing units.21 Without this housing investment in publicly subsidized and income-restricted affordable housing, the Billings area would likely see an even more exacerbated mismatch of units and affordability.
A recent housing analysis of downtown Billings found that construction and development costs lead to rents for a newly constructed 600- or 750-square-foot apartments of $900 or $1,051, respectively.22 A two-bedroom apartment affordable to a very low-income household in Billings would have gross rent (including tenant-paid utilities) of $881 in 2019; that same apartment would be affordable to a low-income household with gross rent of $1,410. This suggests that the Billings housing market is close to being able to provide affordability to low-income and some very low-income households with relatively little subsidy. (As everywhere, new units affordable to extremely low-income households would need significant public subsidy.)
An opening for multi-sector collaboration
During the Minneapolis Fed team’s conversations in Billings earlier this year, stakeholders cited a need for more coordinated activity across the metro area’s community of nonprofits, economic development actors, lenders, and developers to address affordable housing needs. Stakeholders believed such a coordinated effort could address a perceived lack of understanding of the particular needs of Billings’ low-income renters. Other comments pertained to the opportunity a multi-sector housing group could offer. A summary:
- Nonprofits and developers reported that the housing needs of low-income residents are often left out of large economic development plans.
- Developers reported a lack of interest on the part of lenders in creatively financed or designed approaches to increase the housing supply. They named in particular a belief by lenders that the housing market can only support large-lot, single-family homes located outside of Billings’ core neighborhoods.
- Developers described a changing relationship with larger lenders in the region. Previously, large financial institutions may have had officers located in Billings who had an affordable housing focus. Currently, most large financial institutions make those decisions in national or regional offices whose lending staff may overlook opportunities in Billings because they do not understand the market.
- Banks and other lenders reported that a lack of a unified vision on housing frustrated their attempts to get more involved in affordable housing efforts.
Data supported the stakeholders’ perception that housing can present a challenge to Billings-area renters’ abilities to succeed economically. While the housing picture is not as dire in Billings as it is in many large metro areas, for the low-income renter population, affordable opportunities are scarce—and there are signs that the situation for them will not improve without thoughtful, coordinated action. If such coordination happens, leaders of Billings’ development, public, financial, philanthropic, and nonprofit sectors are likely to find ways to increase affordable housing opportunities that draw upon the region’s unique strengths and potential.
Endnotes
1 Cost-burden statistics are based on custom tabulations of U.S. Census Bureau data available from the U.S. Department of Housing and Urban Development (HUD) Comprehensive Housing Affordability Strategy (CHAS). Lower-income refers to households earning 50 percent or less of the HUD area median family income for Billings. The data can be accessed via the HUD User data portal. The most recent compilation of data reflects 2012–2016.
2 U.S. Census Bureau, Population and Housing Unit Estimates Table.
3 Ibid.
4 Population data by race are from U.S. Census Bureau, American Community Survey, 2013–2017 and 2006–2010.
5 See footnote 2.
6 U.S. Census Bureau, Building Permits Survey.
7 U.S. Census Bureau, 2017 American Community Survey 1-Year Estimates.
8 U.S. Census Bureau, American Community Survey, 2013–2017.
9 Joint Center for Housing Studies of Harvard University (JCHS), Home Price-to-Income Ratios, chart.
10 JCHS, Since 2000, Real Home Price Growth Has Varied Across the Country, chart.
11 JCHS, Homeownership Affordability Varies Across the Country, map.
12 HUD, CHAS data. See footnote 1.
13 See footnote 8.
14 See footnote 8.
15 See footnote 11.
16 See footnote 8.
17 See footnote 8.
18 See footnote 12.
19 JCHS, The Low-Rent Stock in Most Metros Has Declined Substantially Since 2011, map.
20 HUD, Low-Income Housing Tax Credit database, available at lihtc.huduser.gov/.
21 The Section 8 waitlist was reported on August 27, 2019, in the Billings Gazette. The number of public housing units is reported on the Billings Housing Authority website.
22 Economic and Planning Systems, Inc., for Downtown Billings Urban Renewal District and East Billings Industrial Revitalization District, Downtown Billings Housing Strategy, December 2017.
Libby Starling is Senior Community Development Advisor in Community Development and Engagement at the Federal Reserve Bank of Minneapolis. She focuses on deepening the Bank’s understanding of housing affordability, concentrating on effective housing policies and practices that make a difference for low- and moderate-income families in the Ninth Federal Reserve District.