Authors


Article Highlights
- Systemic racism and employer discrimination disadvantage Minnesotans of color
- White workers enjoy lower unemployment rates during good and bad economic times
- Workers of color have lower annual earnings than White workers
Minnesotans of color and Native Americans face a much more challenging labor market than do their White non-Latino/a neighbors.1 Black, Latino/a, Native American, and Asian workers must deal with the impacts of systemic racism, such as discrimination and disparate opportunities in employment and earnings, albeit in different ways for individuals within each group. Unequal labor market outcomes are not a consequence of the labor market alone but also reflect the institutionalization of systemic racism through less opportunity in education, housing, location, and the criminal justice system.2
Today, people of color represent about one in five members of Minnesota’s workforce, more than doubling as a share of the workforce over the last 25 years, from 7.7 percent in 1995 to 19.3 percent in 2019.3 Along with the benefit of their skills, talents, and work ethic, these Minnesotans bring the burden of cumulative disadvantages—from more limited educational opportunities to disproportionate criminal justice involvement—to their experience in the labor market. The rising share of people of color in Minnesota’s labor force is driven in part by international immigration (Warfa 2019). Half of Minnesotans of color—49.3 percent—are foreign-born, compared to 1.9 percent of White Minnesotans.4 These international immigrants may face additional employment challenges in the forms of limited language proficiency and cultural differences with their employers.
Disparities in access to opportunity start young. Investments in young children have high social returns (Rolnick and Grunewald 2003), and Minnesotans of color face barriers to accessing high-quality early childhood education (Children’s Defense Fund–Minnesota 2017). Inequitable access to high-quality K-12 education in Minnesota has resulted in some of the nation’s largest gaps in educational outcomes by race and ethnicity (Grunewald and Nath 2019): White students in Minnesota have higher average standardized-test scores and graduation rates than students of color. Furthermore, analysis of post-secondary enrollment and graduation records has found that students who attended higher-poverty high schools—who are more likely to be students of color—are more likely to need remedial work, take longer to complete college, and drop out of college (Leibert 2018).
Public policies like redlining and systemic housing discrimination have shaped residential patterns to the disadvantage of people of color (Solomon, Maxwell, and Castro 2019; Mapping Prejudice 2020). In the Minneapolis-St. Paul metro area, a lack of affordable housing can reinforce this exclusion by limiting access to high-quality jobs (Gobillon, Selod, and Zenou 2007; Shoag 2019), particularly in exurban locations characterized by both job growth and a lack of multifamily housing.
Black and Latino/a workers—and, in some cases, other workers of color—often live and work in systematically different locations than White workers (Guthrie et al. 2019; Fan, Guthrie, and Das 2016). For example, in the Twin Cities metro area, neighborhoods where many lower-income people of color live are in more central locations, such as cities of Minneapolis, St. Paul, and older suburbs. As many industrial jobs have moved to more land-rich suburban and exurban locations, these neighborhoods are more likely to have higher unemployment. In a more rural example, Native American college graduates who live in rural reservations face limited occupational options and job opportunities (Leibert 2018).
As Black, Latino/a, and Native American Minnesotans are more likely to be incarcerated than White Minnesotans (The Sentencing Project 2020), criminal justice disparities further compound the labor market disparities disadvantaging many workers of color. When people who were formerly incarcerated reenter the workforce, their ability to secure and maintain high-quality employment is often very limited (Western and Sirois 2018; Raphael 2007).
Employer discrimination disadvantages workers of color
Racial discrimination by Minnesota employers plays an important role in generating the racial disparities seen in the labor market. In many labor markets, employers have discretion to hire using both economically relevant considerations (e.g., an applicant’s skills) and irrelevant or even illegal considerations (e.g., an applicant’s race or ethnicity). With the difficulty of both proving inequitable treatment and enforcing laws against it, hiring discrimination persists despite legal prohibitions.
Labor market researchers have found that some employers treat Black and White job applicants differently, even when those applicants appear otherwise identical (Pager 2007; Pager, Western, and Bonikowski 2009). Because of the challenges of finding “otherwise identical” applicants of different races, researchers have used experimental approaches like the audit study: carefully selected applicants of different races, equipped with nearly identical resumes, apply in person for many jobs. Researchers then observe how many callbacks—i.e., calls for follow-up interviews—each applicant receives.
When applied to employers in the seven-county Twin Cities area, this approach yielded striking evidence of racial disparities in hiring (Uggen et al. 2014). Callback rates for White applicants were more than 10 percentage points above those of their Black counterparts with near-identical (fictitious) biographies and resumes.5 Black Minnesotan workers in particular have been shown to receive dramatically fewer callbacks from employers even when their job applications are identical to those of White counterparts (Uggen et al. 2014). Similar research conducted in New York City found that Latino/a workers are less likely to receive favorable employer responses than otherwise identical White job seekers (Pager, Western, Bonikowski 2009).
To better understand the role of criminal justice records in hiring, the researchers who conducted the Twin Cities-area audit study examined callback rates for applicants with a prior misdemeanor arrest. While callback rates were about 4 percentage points lower for both Black and White applicants with a misdemeanor arrest, only 27.5 percent of Black applicants with no arrest history received callbacks, compared with 34.7 percent of White applicants with a prior arrest and 38.8 percent of White applicants with no arrest history (see Figure 1).6
Labor market discrimination has many detrimental effects on workers of color, including:
- Reducing the likelihood of being hired, whether for a first job or career advancement;
- Steering workers of color into lower-paid occupations (Hamilton, Austin, and Darity Jr. 2011); and thereby
- Contributing to lower earnings for workers of color compared to White workers (del Río and Alonso-Villar 2015).
Fundamentally, the continued existence of labor market discrimination contradicts the presumption that people of all races and ethnicities receive equal consideration in the labor market.
White workers enjoy lower unemployment rates through good times and bad
Whether in economic booms or downturns, the unemployment rate for White workers in Minnesota is always lower than that for Black and Latino/a workers. In the strong labor market of 2019, unemployment rates were low across the board, but the White and Asian rates (3.0 percent and 2.4 percent, respectively) remained well below the Black and Latino/a rates (5.5 percent and 5.0 percent, respectively) (see Figure 2). During difficult economic times, those differences are magnified. For example, in 2010, the unemployment rate for White workers (6.4 percent) was high, but rates for Asian (11.7 percent), Black (22.0 percent), and Latino/a (12.3 percent) workers were much higher.7
Racial gaps in unemployment also exist for the U.S. as a whole: over the last 50 years, the Black unemployment rate in the U.S. has consistently been at least twice the White unemployment rate (Ajilore 2020). Native American workers also experience much higher unemployment rates—6.1 percent in 2019, in contrast to the White rate of 3.3 percent nationally.8 However, Minnesota’s unemployment rate gaps have historically been especially large (Minnesota Advisory Committee to the U.S. Commission on Civil Rights 2013).9
Given the high labor market returns from education, higher educational attainment gives White and Asian workers an advantage both in earnings and unemployment rates (National Center for Education Statistics 2019).10 However, adjustments for differing levels of educational attainment are not sufficient to erase racial and ethnic gaps in unemployment. While White and Asian workers with a high school degree or less had a 2019 unemployment rate of 4.9 percent and 3.9 percent, respectively, Black and Latino/a workers in Minnesota with the same education had unemployment rates of 8.2 percent and 5.8 percent, respectively (Current Population Survey 2019 and authors’ calculations).
Tight labor markets (i.e., those with low unemployment) confer particular benefits on disadvantaged workers, including workers of color (Cajner et al. 2017; Aaronson et al. 2019). While the fiscal and monetary policy actions that support tight labor markets cannot themselves erase racial and ethnic gaps in unemployment, they do reduce the size of those gaps in absolute terms.
Cumulative disadvantage results in lower earnings for workers of color
Native American, Black, Latino/a, and Hmong workers in Minnesota tend to have lower annual earnings, with medians of $27,900, $28,700, $29,000, and $35,000, respectively (see Figure 3).11 By contrast, Asian workers (excluding the Hmong population) and White workers have median earnings of $42,800 and $47,900, respectively.12
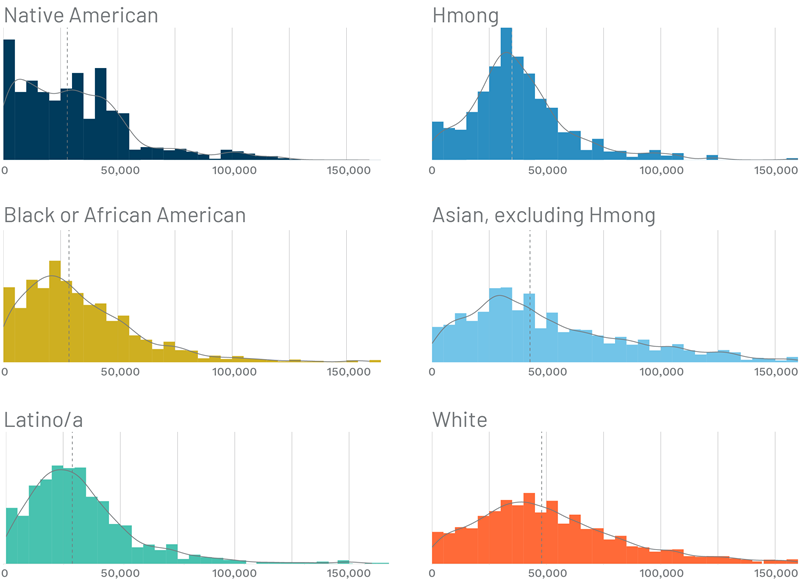
Source: American Community Survey 5-Year Public Use Microdata Sample (2014–2018) and authors’ calculations.
These racial and ethnic earnings disparities are larger in Minnesota than in the U.S. as a whole: for example, while White workers in Minnesota have median earnings 1.7 times that of their Black counterparts, and 1.7 times that of their Latino/a counterparts, those multiples are only 1.4 and 1.5 for Black and Latino/a workers across the U.S. Higher earnings for White Minnesotans and lower earnings for Minnesotans of color—relative to their national counterparts—are both part of the explanation.
White and Asian (excluding Hmong) workers in Minnesota have the widest distribution in earnings; i.e., any given worker tends to earn much less or much more than the group average. (The same is true in the U.S. as a whole.) However, when scaling earnings variation by the different average earnings levels, the story is different: Native American and Latino/a workers vary the most, with Hmong and White workers varying the least.13
Educational differences are part of the story of earnings disparities, given the large earnings advantage enjoyed by those with more education. For example, Latino/a workers in Minnesota are much more likely (31.8 percent) than White workers (2.4 percent) to have less than a high school education.14 However, the pattern of earnings disparities remains, even for workers with the same level of educational attainment: among workers with less than a high school diploma, median Black workers’ earnings are $17,900, Latino/a workers’ earnings are $24,600, and Native American workers’ earnings are $25,300, compared to their White counterparts with median earnings of $30,400 (see Figure 4).
Black and Latino/a workers (and, in some cases, other workers of color) often work in systematically different occupations than White workers (Hamilton, Austin, and Darity Jr. 2011; del Río and Alonso-Villar 2015; Hellerstein and Neumark 2008). In turn, these occupations tend to feature weaker labor demand, higher unemployment, and lower wages. For example, in a low-paid occupation like dishwashing—with annual median earnings of only $14,000—17.0 percent of Minnesotan workers are Black and 24.1 percent are Latino/a. These shares are far above Black and Latino/a workers’ 5.1 percent and 4.6 percent shares of all Minnesota workers.15
Even when workers of different races are in the same occupation, segregation by industry can create and perpetuate earnings differences. For example, White and Asian registered nurses and licensed practical nurses are more likely to work in higher-paying hospital jobs, while Black registered nurses and licensed practical nurses are more likely to work in lower-paying nursing homes (Leibert 2015).
In addition, the institutions and employer practices that characterize labor markets are critical. For example, a substantial share of workers are not employed by the firm that ultimately uses their services, which can limit their ability to participate in the success of that firm (in part by limiting their ability to bargain collectively) (Weil 2017; Nunn and O’Donnell 2020). Workers in this situation—temporary agency and contract workers in particular—are disproportionately Black or Latino/a and are on average paid less than “traditional” workers (BLS 2018). Black, Asian, and Latino/a graduates with certificates in manufacturing from Minnesota institutions are more likely than White graduates to accept jobs with temporary help agencies rather than manufacturers directly, creating an earnings disparity that persists for years (Leibert 2015).
Policy solutions should address the systemic nature of disparities
Too often, researchers ignore, underemphasize, or present without context the racial disparities in economic outcomes that are the focus of this article. Racial disparities in earnings and unemployment do not result from an impartial marketplace. Rather, they reflect cascading disadvantages—many caused by public policy—that can start at birth.
The Minnesota labor market gaps we assess are stark. During the depths of the Great Recession, the Black unemployment rate was more than three times that of Whites, and in the pandemic recession of 2020 is more than double the White unemployment rate. Earnings are similarly unequal: Native American, Black, Latino/a, and Hmong workers in Minnesota have median earnings ranging from $27,900 to $35,000, while White workers have median earnings of $47,900. As we show, these gaps are related to substantial employer discrimination in Minnesota that makes it harder for workers of color to obtain jobs, even when their credentials are equal to those of White applicants.
The policy solutions to these problems are outside the scope of this article. However, policymakers should ground proposed solutions in an understanding of not only the scale of racial disparities but also the systemic issues that sustain these disparities.
Authors’ note: We thank Tyler Boesch for excellent research assistance and Tomaz Cajner, Oriane Casale, Maureen Ramirez, Christopher Uggen, and Hamse Warfa for insightful feedback on a previous draft.
Endnotes
1 For simplicity, we refer to White non-Latino/a as White. In this analysis, the Black, Native American, and Asian racial groups are also exclusive of Latino/a origin.
2 We will focus specifically on disparities in early childhood development and K-12 education in a subsequent article in this series.
3 U.S. Census Bureau Longitudinal-Employer Household Dynamics Program, Quarterly Workforce Indicators, accessed on October 7, 2020, and authors’ calculations. The term “people of color” includes Native Americans wherever the available data allow.
4 Conversely, 84.7 percent of foreign-born labor force participants are people of color. Source: American Community Survey 5-Year Public Use Microdata Sample (2014–2018) and authors’ calculations.
5 The research highlighted in Figure 1 did not encompass other racial and ethnic groups.
6 Minnesota’s “Ban the Box” law was extended to private employers in 2014, after the analysis we feature in Figure 1 was published. This law postpones employers’ inquiries into a prospective employee’s criminal history until after a callback occurs.
7 Averaging over March 2020 through August 2020, unemployment rates in Minnesota were lower for Whites (6.6 percent) than for Asians (10.0 percent), Blacks (16.6 percent), and Latinos/as (9.6 percent) (Current Population Survey and authors’ calculations). It is notable that the cyclicality of unemployment rates for Asian workers in Minnesota is especially high, with very low unemployment during booms and very high unemployment during downturns.
8 See Feir and Golding (2020) for analysis of Native American unemployment rate gaps during the 2020 recession. We do not report Minnesota-specific unemployment rates for Native American workers because the BLS data we rely on for these estimates do not allow us to do so.
9 Because their labor market experience is more challenging, Black, Latino/a, and Native American workers in the U.S. are also more likely than White and Asian workers to leave the labor force for long stretches of time due to low odds of finding a job (Cajner et al. 2017; Austin 2013). Furthermore, Black and Latino/a workers in Minnesota are all more likely than White workers to work part-time for economic reasons, meaning that they would prefer full-time employment but cannot find it. Among employed workers age 16 and older in Minnesota, 4.7 percent of Latino/a and 4.3 percent of Black workers work part-time for economic reasons, compared to 3.2 percent of White workers (Current Population Survey 2019 and 2020, and authors’ calculations).
10 It is important to note that the experience of Hmong residents of Minnesota is generally quite different than that of other Asian residents, as shown in Figure 3.
11 Our analysis includes all workers with positive earnings, including those who work part-time. We find similar patterns when limiting the analysis to full-time workers.
12 We show Hmong workers separately in Figure 3 because they constitute a significant share of the Minnesota workforce and their labor market experience is substantially different than that of other Asian workers.
13 For this comparison, we use the coefficient of variation, which is calculated as the standard deviation divided by the mean of earnings for each racial and ethnic group.
14 The sample is restricted to those between the ages of 25 and 54 who report positive earnings in the previous year. Source: American Community Survey 5-Year Public Use Microdata Sample (2014–2018) and authors’ calculations.
15 Calculations are based on the American Community Survey 5-year Public Use Microdata Sample (2014–2018).
Libby Starling is Senior Community Development Advisor in Community Development and Engagement at the Federal Reserve Bank of Minneapolis. She focuses on deepening the Bank’s understanding of housing affordability, concentrating on effective housing policies and practices that make a difference for low- and moderate-income families in the Ninth Federal Reserve District.