

Homeowners-to-Population Data
A portal for accessing the data and calculations behind the homeowners-to-population ratio, or HPOP, an alternative measure of homeownership
Saint Paul Housing Dashboard
Minneapolis Fed tool monitors the housing market in Minnesota’s capital city
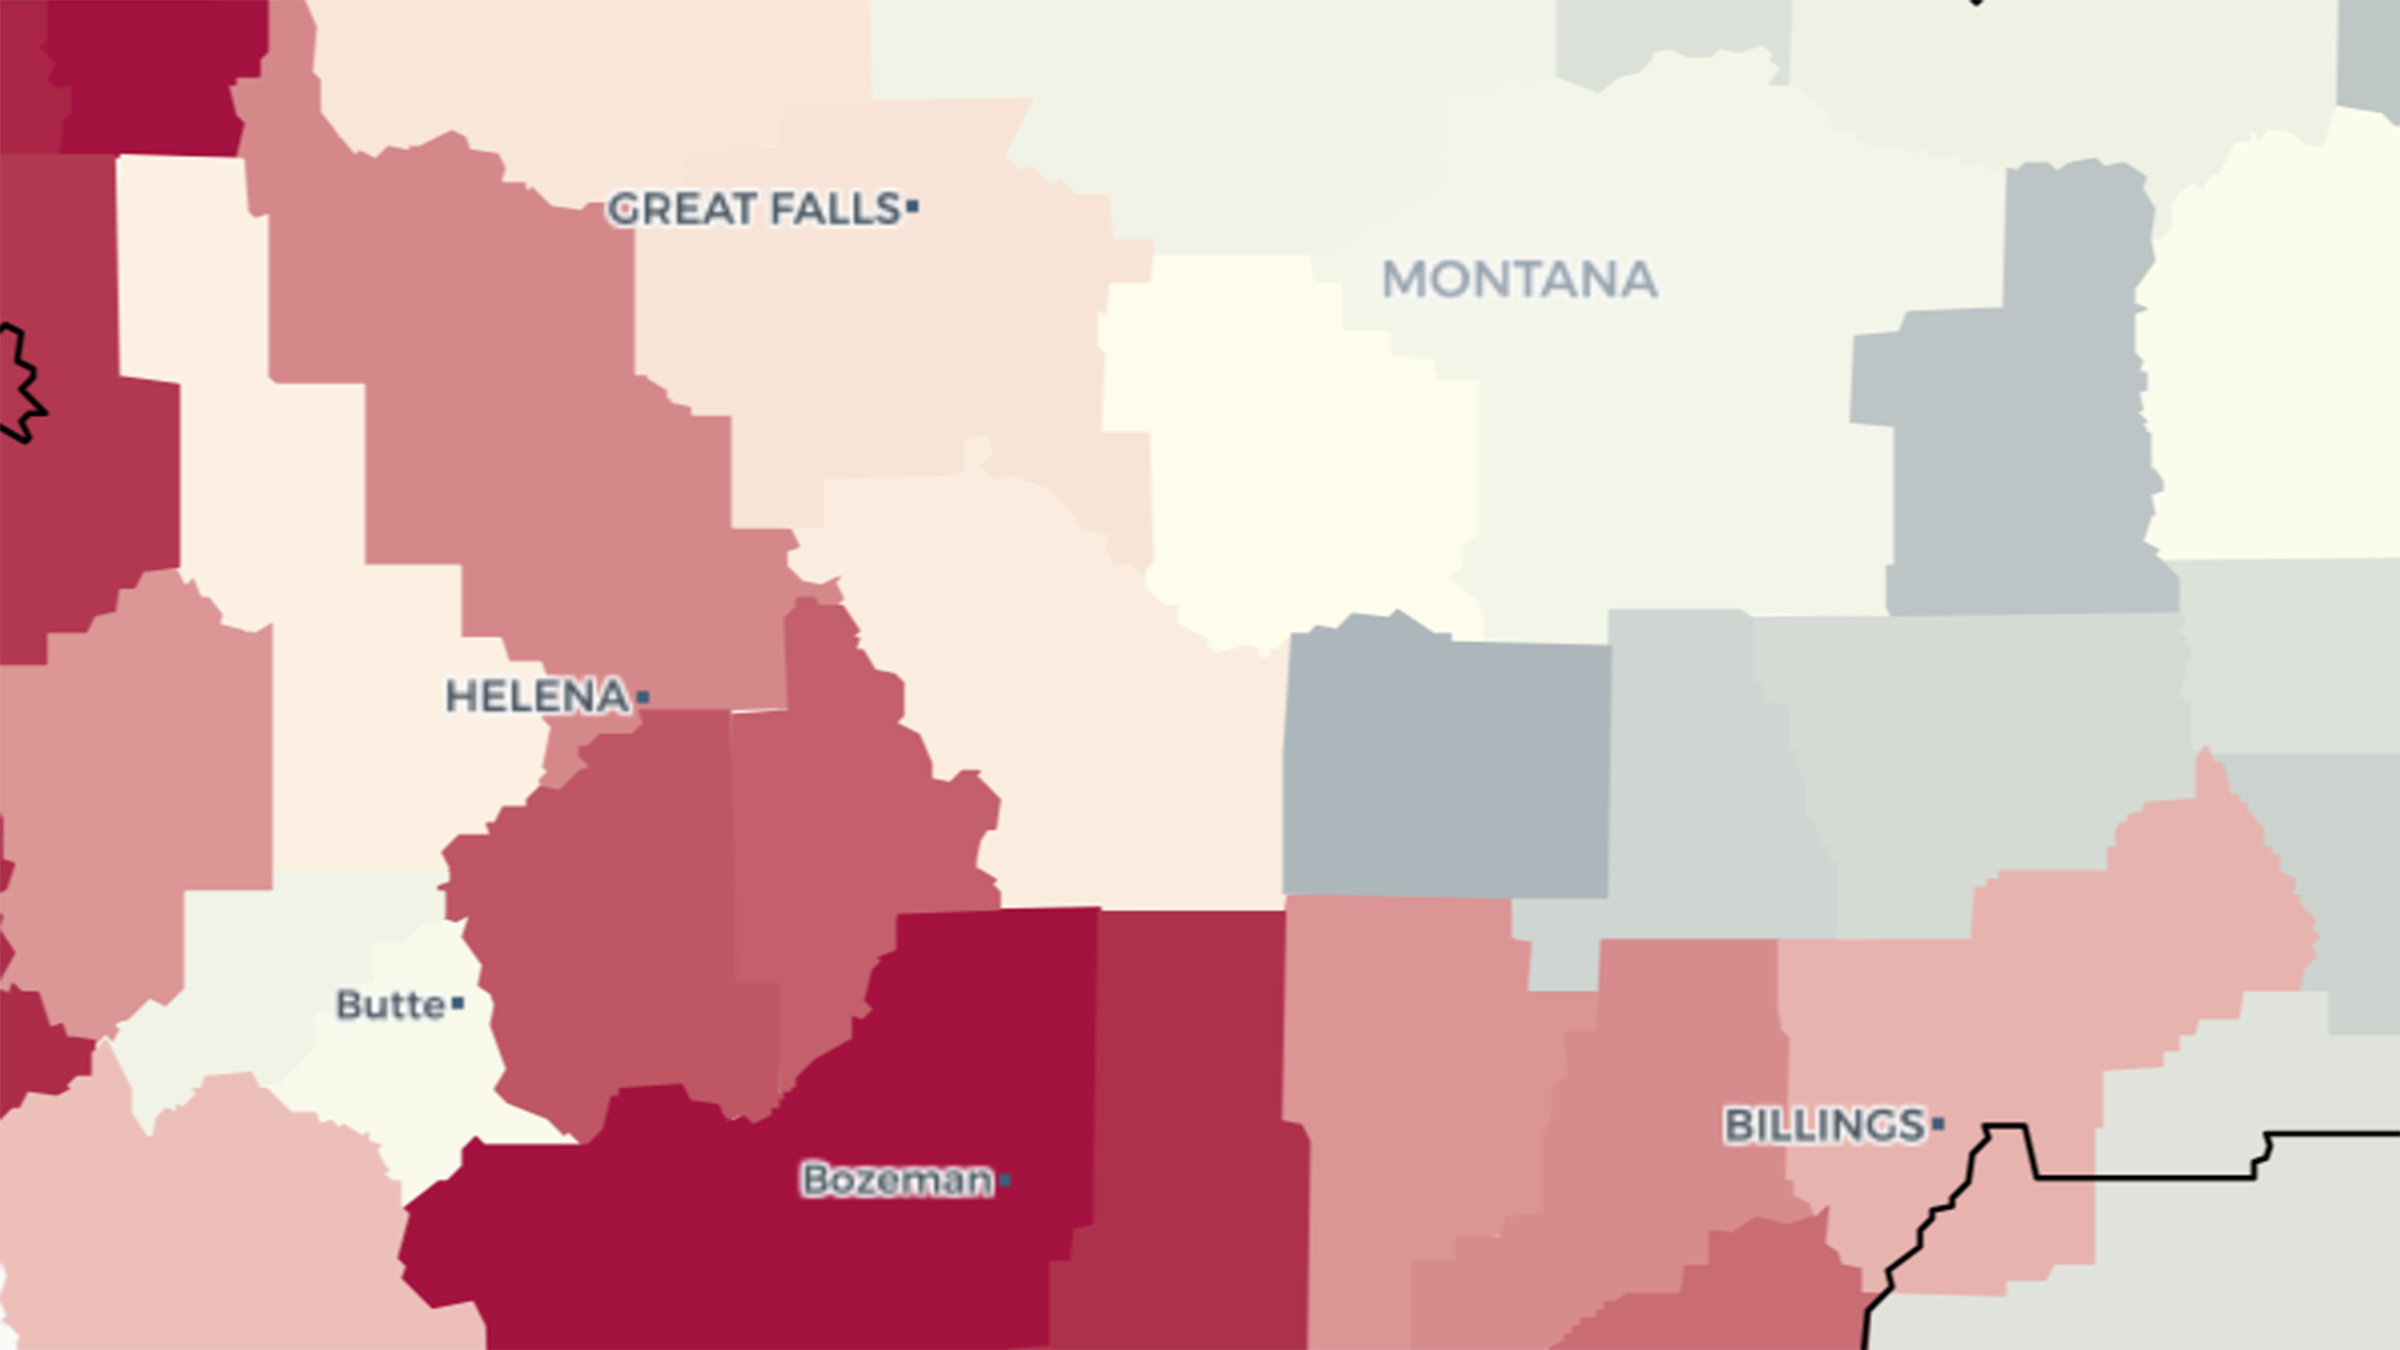
Montana Housing Dashboard
Minneapolis Fed tool tracks data to inform housing policy and planning in Montana.

Twin Cities Metro Migration Dashboard
Minneapolis Fed tool tallies people’s moves into, out of, and across the Minneapolis-St. Paul area.

Occupational Licensing Dashboard
Our tool offers data on occupational licensing for all 50 states and more than 100 occupations.

Investor-owned homes
Minneapolis Fed tool highlights critical data about concentrations of investor-owned homes.
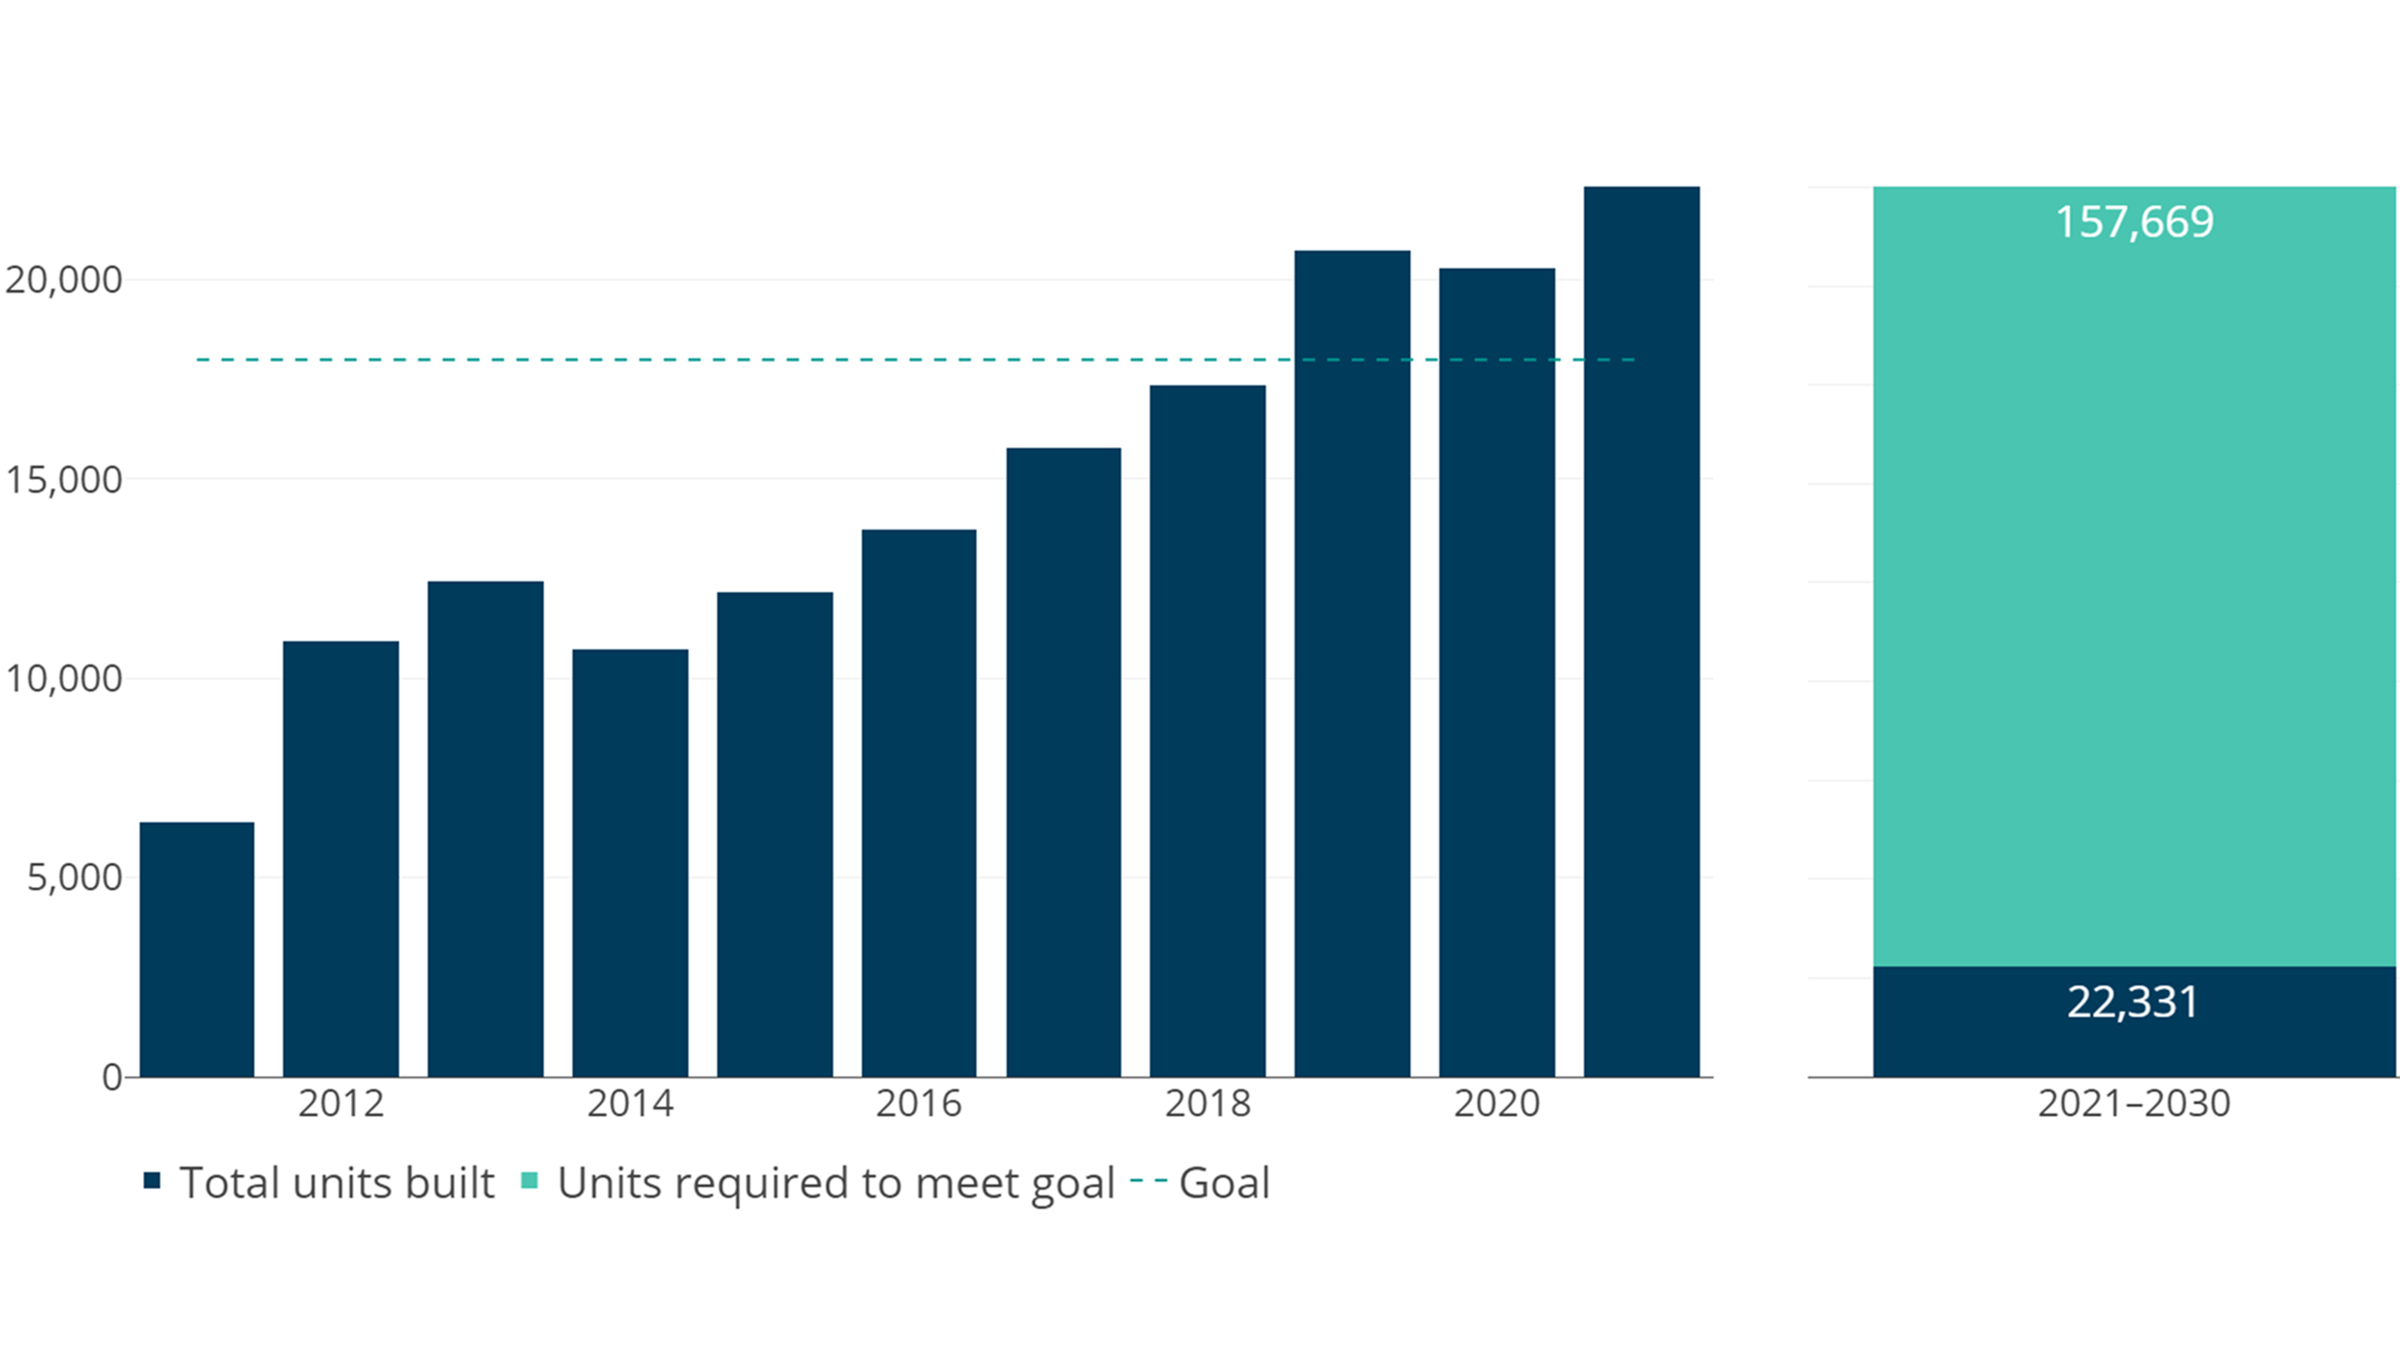
Regional Housing Affordability Dashboard
In addition to measuring progress against three regional housing affordability goals, the dashboard developed and maintained by the Minneapolis Fed monitors 10 housing-related indicators that reflect the full range of the housing market. It also provides context on how these outcomes vary across the Twin Cities region and compare to peer regions.
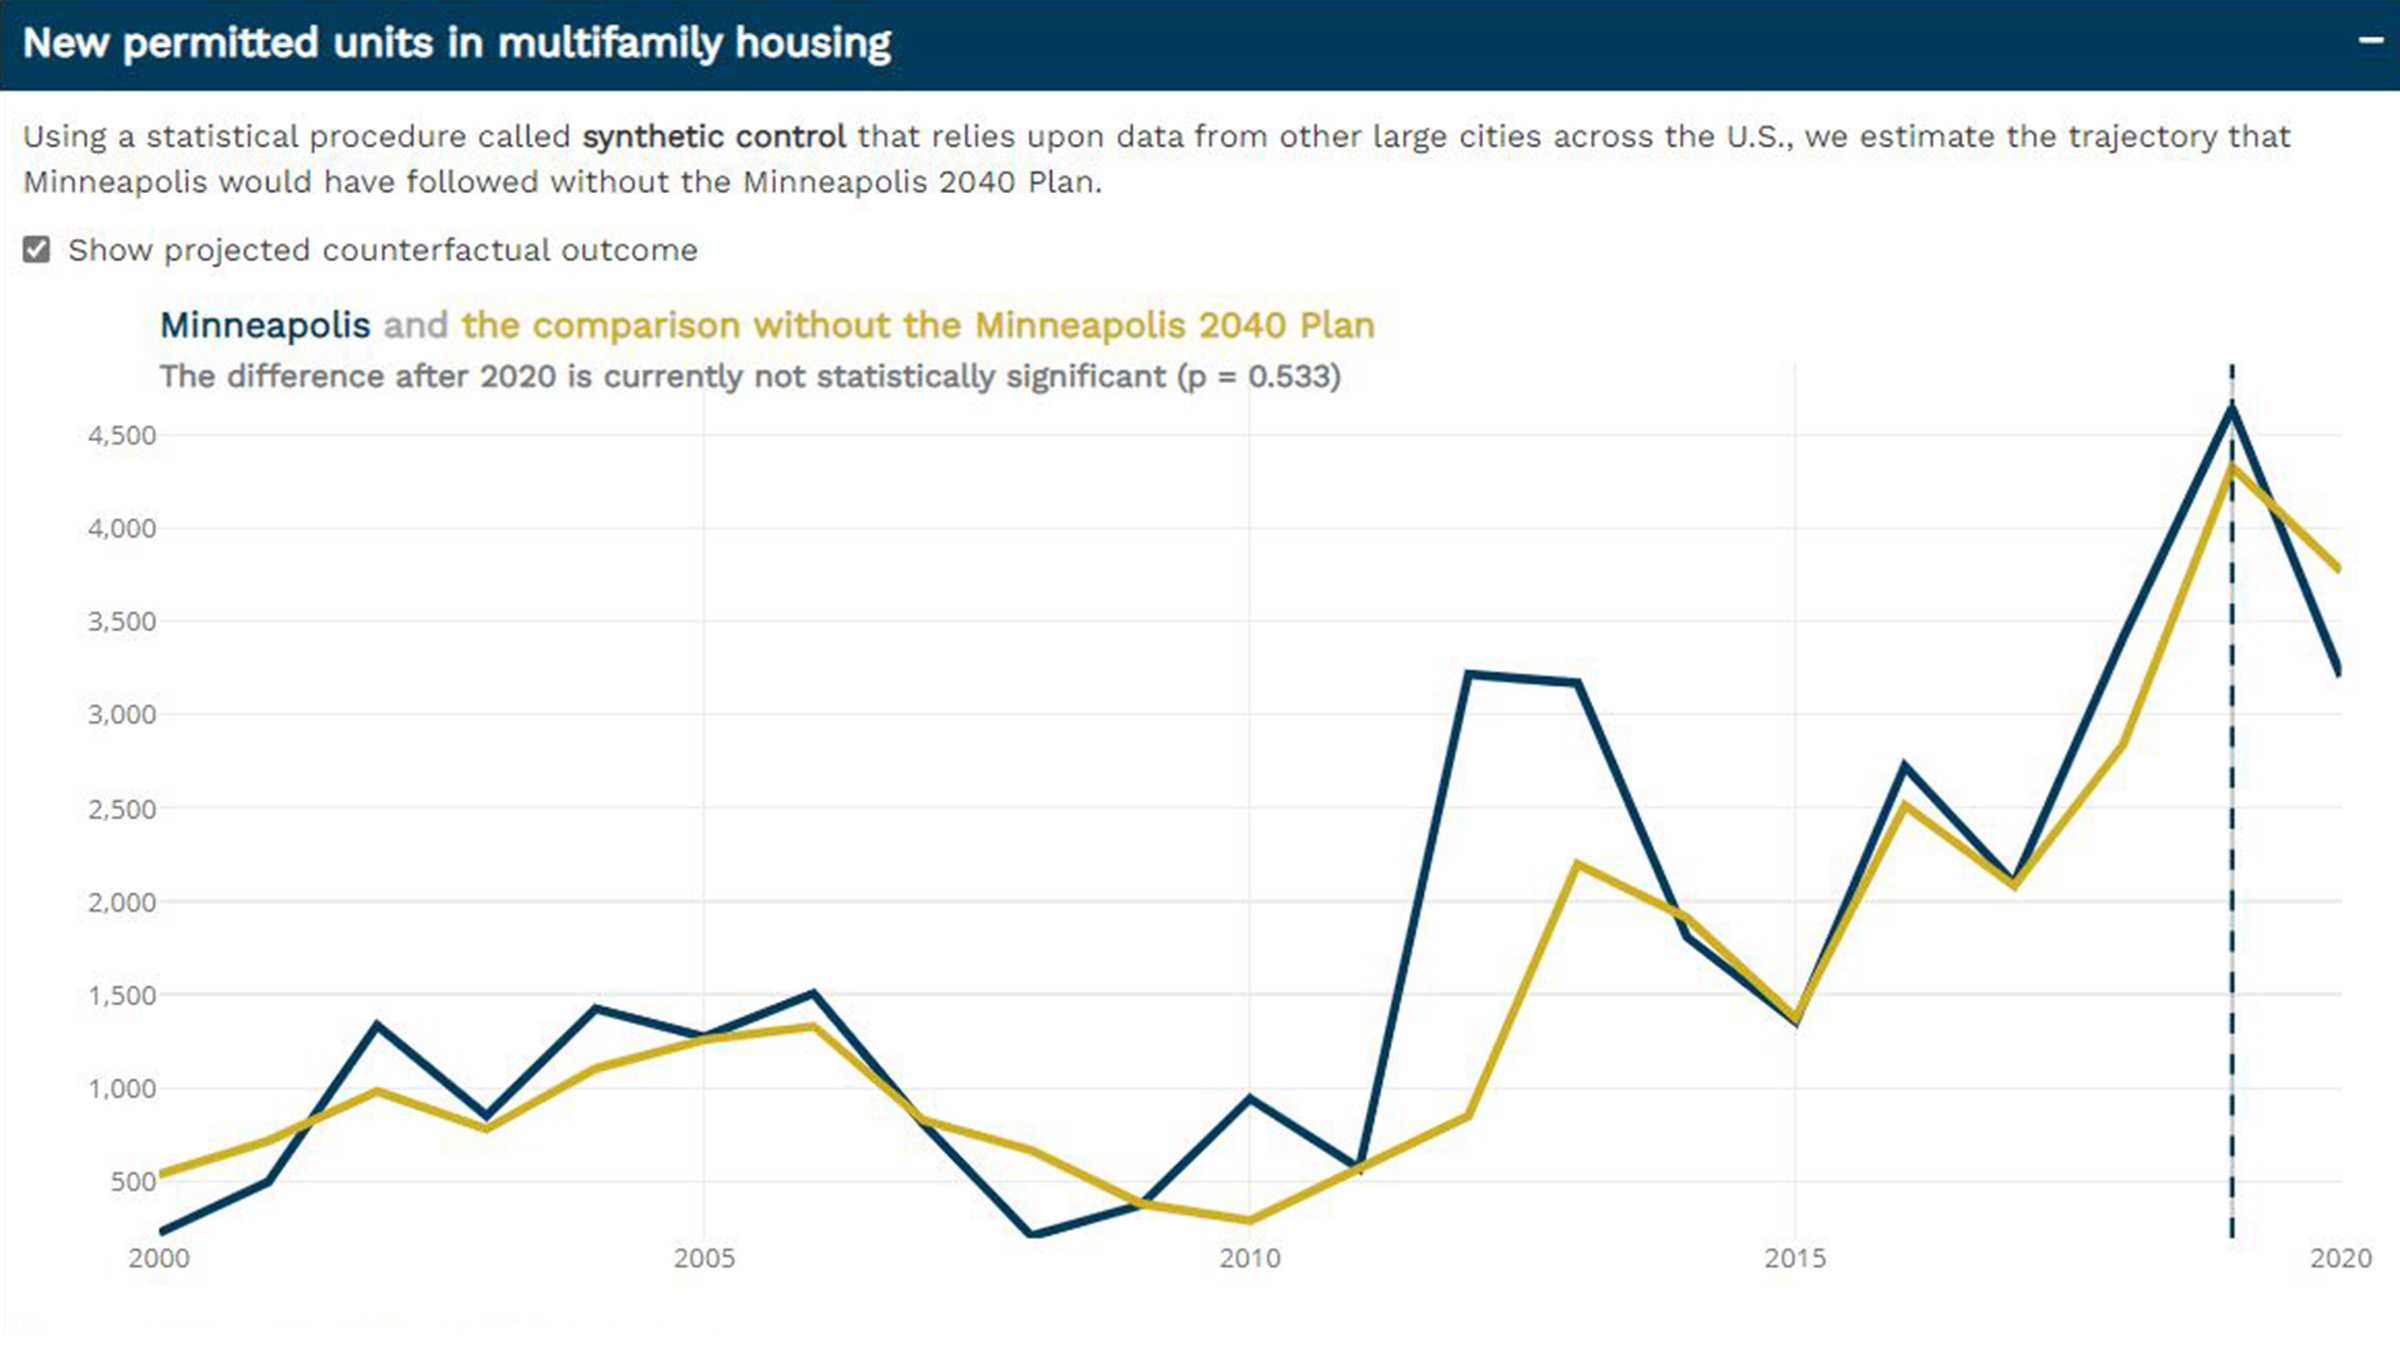
Minneapolis 2040 Housing Indicators
The Minneapolis Fed’s new dashboard monitors ten housing-related outcomes from the City of Minneapolis’ Minneapolis 2040 comprehensive plan and associated policy changes, as well as relevant information that provides context on how these outcomes vary across Minneapolis neighborhoods and compare to peer cities.

Find a CDFI tool
This Minneapolis Fed tool enables users to search for certified Community Development Financial Institutions in their neighborhood, city, or region.
Ninth District mortgage performance dashboard
Minneapolis Fed releases new data tool to monitor mortgage performance in the Ninth District.

Twin Cities credit profile
Twin Cities Community Credit Profile measures residents’ participation in the credit economy to show how consumer credit access varies across place and time. Our tool focuses on indicators, such as credit scores, that lenders use to determine who has access to credit and on what terms. Reflecting underlying economic disparities, credit scores may be imperfect indicators of borrowers’ likelihood of repaying their debts.
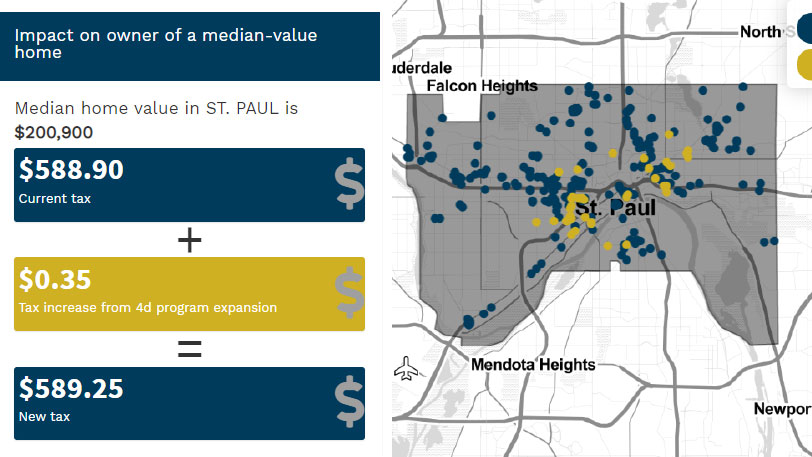
4d tool
Interactive tool enables governments in the Twin Cities area to estimate city tax impacts of preserving naturally occurring affordable housing.